The Importance Of
Creating This Proposed Earthquake Forecasting Program
The United Nations Might Be The Most Appropriate Organization
For
Creating And Running This
Proposed Earthquake Forecasting Program
There Are Presently No Globally
Effective Earthquake
Forecasting Programs Being Run By Anyone, Anywhere
How A
United Nations Related Earthquake Forecasting Program Would
Be Run
Collect Earthquake Precursor Data
Evaluate The Earthquake Precursor Data
Prepare Earthquake Warnings
Circulate Earthquake Warnings
Earthquake Forecasting Program
Support Operations
Earthquake Forecasting Program Structure - A
Nonprofit Foundation
Get Funding To Create And Run The
Forecasting Program
Forecasting Program Expenses
Develop Earthquake Forecasting Methodology
Develop Disaster Mitigation Plans For Responding To Earthquake
Warnings
Work With Earthquake Researchers Around The World To Develop
Better Earthquake Forecasting Technologies
Recognizing And Avoiding One Of The
Most Serious Earthquake Forecasting Program Related
Problems
THE IMPORTANCE OF
CREATING THIS PROPOSED UNITED
NATIONS
EARTHQUAKE FORECASTING PROGRAM
The United Nations Might Be The Most
Appropriate Organization For
Creating And Running This Proposed Earthquake Forecasting
Program
The earthquake forecasting
program being discussed in this section could probably be
created and run by any major world government or nongovernmental
organization. However, for a number of reasons including
the following ones, the United Nations might be the most
appropriate organization to run or at least monitor and help
support the program's operations.
First - U.N. personnel are in constant contact
with all world governments.
Second - U.N. personnel might find it easiest to raise
the funds needed to run the program.
The United Nations might be
the organization that would have the easiest time raising funds
for creating and running this proposed earthquake forecasting
program. This is because unexpected, highly
destructive earthquakes directly or indirectly affect the
economy of every nation. And so, many world governments
might be willing to provide the U.N. with funding assistance if
U.N. personnel could demonstrate to them that there is a good
chance that U.N.-related personnel could actually create and run
an effective earthquake forecasting program.
There Are Presently No Globally
Effective Earthquake
Forecasting Programs Being Run By Anyone, Anywhere
As far as I can tell, at
this time there are no organizations that are actively looking
for, collecting, and evaluating all, or even many, of the
tremendous number of high quality
Earthquake Precursor data
that are available from sources around the world. As a
consequence there appear to be very few if any
effective
earthquake warnings being generated or circulated by government
agencies, independent groups, or individual earthquake
forecasters.
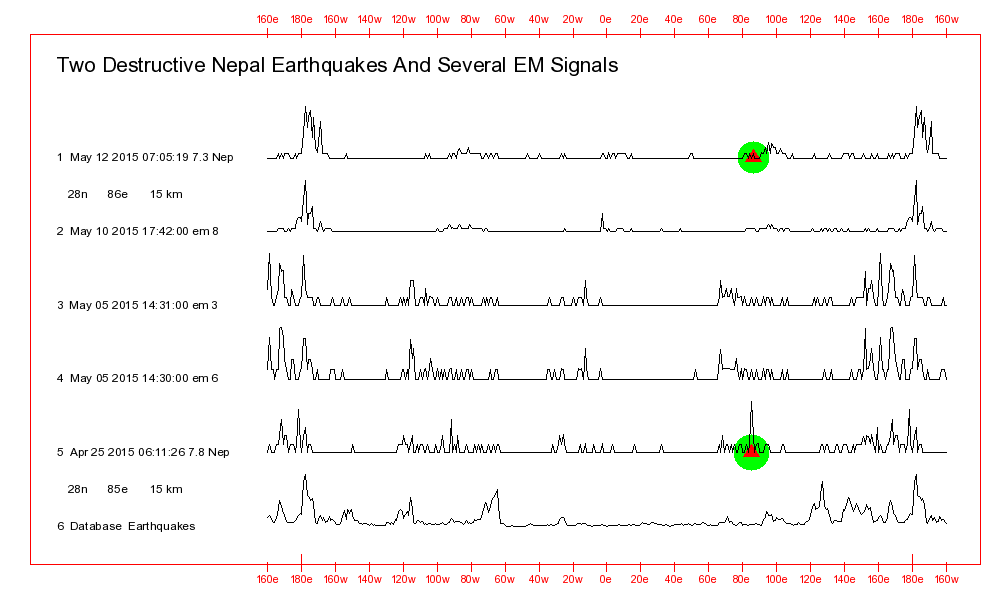
For one example,
My own May 8, 2015
internationally circulated warning for a possible significant
earthquake aftershock for the destructive April 25, 2015
earthquake in Nepal, discussed in the
Aftershocks
section of this Web page, did not appear to accomplish anything.
The warning was, I believe,
seen by Nepal Government officials plus some international
disaster mitigation groups including a few U.S. Government
officials. But there were no organizations in existence
that had the ability to accurately evaluate and effectively
react to the warning.
The expected Nepal
aftershock occurred on May 12, 2015, four days after my
aftershock warning was circulated. As far as I can tell,
people living in Nepal who needed to know about the aftershock's
approach were unaware that the aftershock was about to
occur. And without their receiving a warning regarding its
approach, when it did occur it was highly destructive.
For two other
examples,
First, my data
indicate to me that the following extremely powerful and
destructive March 11, 2011 Japan area earthquake was generating
distinct EM Signals for a good nine months before it occurred:
2011/03/11 05:46:24 38.30N 142.34E 32 9.0 Japan Area
Second, clear EM
Signals were being generated for perhaps a year and a half
before the following destructive September 16, 2015 Chile area
earthquake:
2015/09/16 22:54:33 31.57S 71.65W 25 8.3 "46km W of
Illapel, Chile"
As the
Elusive and Deceptive Earthquake
Precursors section of this Web page explains, earthquake
precursor data can be highly complex, elusive, and
deceptive. And at this time, perhaps the only organization
that might have the necessary resources to be able to
effectively collect and process all of those precursor data
would be a special earthquake forecasting group that would be
created by the United Nations.
Efforts by the United
Nations or any other organization to create an earthquake
forecasting group would have to be carefully done for a variety
of reasons. For one, as stated earlier in this section,
the powerful and destructive September 16, 2015 earthquake in
the Chile area appears to have been generating strong warning
signals for a good year and a half before it finally
occurred. So, forecasting personnel would need to be
sufficiently skilled at interpreting the earthquake precursor
data that they could accurately determine
when that
earthquake was actually going to occur rather than have people
in some fault zone area sleeping in tents for more than a year.
Another problem, one
that many earthquake researchers are likely not aware of is the
fact, believed by some researchers including me, that solar and
geomagnetic storms can have an impact on the time when
earthquakes are going to occur. Earthquakes occurrence
times are not always associated
only with the slow
movement of tectonic plates relative to one another.
There would undoubtedly be
many other problems associated with having a United
Nations-related group attempt to forecast earthquakes.
But, if no efforts are ever made to create such a forecasting
group then it might be quite a few years before we will be able
to effectively predict and then warn people about approaching
earthquakes.
HOW A UNITED
NATIONS RELATED EARTHQUAKE
FORECASTING PROGRAM WOULD BE RUN
Briefly, to tell
when
a significant earthquake is going to occur, and to
warn
people about its approach, two things are needed:
First - There have to be Earthquake Precursor
data available that can accurately indicate that the
significant earthquake is approaching.
Second - There need to be some people who
can evaluate those data and circulate a timely warning
for the expected earthquake.
The following are
explanations for how earthquake precursor data could be
collected and how effective earthquake warnings could be
circulated.
Collect Earthquake Precursor Data.
There are a large number of
Earthquake Forecasting Methods
in existence that are already generating useful earthquake
precursor data. Several of them plus some proposed new
methods are already being or are scheduled to be discussed on
this Web page.
United Nations personnel
might be able to collect or generate some precursor data
themselves. But they would probably have to obtain most of
their precursor data from various government agencies,
earthquake research groups, and independent researchers around
the world.
Initially at least,
United Nations program personnel might have the best success
if they paid earthquake
researchers around the world to send them precursor data.
Some
earthquake forecasters would probably be willing to send United
Nations personnel their earthquake precursor data for free
because they are concerned about the many lives that can be lost
during unexpected, powerful earthquakes. My own precursor
data are available for free for anyone to use.
Most,
if not all, earthquake researchers would probably be
willing to send United Nations personnel their earthquake
precursor data if they were being paid for their efforts.
There are so many different
types of precursor data available from various sources that the
data collection process would likely need to be automated to
some degree. For example, as proposed in the
Internet Web-Based
Earthquake Forecasting Method section of this Web
page, data could be sent to some Web site run by the United
Nations. If U.N. personnel were to attempt to collect the
data through telephone conversations etc. they would likely be
quickly overwhelmed by the sheer volume of data.
Fortunately, earthquake
precursor data collection efforts would likely be easier and
less expensive these days than in years past. That is
because many precursor data can be automatically collected and
evaluated by computer analyses of readily available
Earth-orbiting satellite data.
Evaluate The Earthquake Precursor Data
From a technical point of
view, this would be the most difficult part of running the
earthquake forecasting program.
As explained in the
Elusive and Deceptive Nature
Of Earthquake Precursors section of this Web page,
it can at times be difficult to accurately determine what
earthquake precursor data are saying with regard to when and
where an earthquake is going to occur. However, data that
I have seen from various researchers indicate to me that there
are sufficient amounts of different types of precursor data
available that it should be possible to eventually learn how to
compare those data and accurately forecast a good percentage of
our significant earthquakes.
As one of the following
sections of this Web page explains, the task of evaluating the
precursor data would be so complex that it might require the
efforts of as many as 30 full-time United Nations earthquake
forecasters plus support staff. During those evaluation
processes U.N. personnel would be constantly exchanging data
with and working with government agency personnel, with
nongovernmental organization personnel, and with independent
earthquake researchers around the world.
Prepare Earthquake Warnings
When their analyses
of earthquake precursor data indicated that it was necessary,
United Nations earthquake forecasting program personnel would
prepare earthquake warnings for use by U.N. disaster mitigation
groups, and for circulation to other disaster mitigation
organizations, governments, other earthquake forecasting groups,
individual earthquake researchers, and the general public.
Different types and amounts
of information sent to the various organizations, groups,
individuals, and the general public would be formatted
differently depending on what was appropriate for each group
etc. to receive.
For example, warning
information circulated to the general public would usually be
dramatically different than the information circulated to
earthquake forecasting groups. Warnings sent to the
forecasting groups would contain more technical types of
information.
An important point that is
explained in more detail in the
Myth # 3 part of the
Earthquake
Forecasting Myths section of this Web page is that
contrary to what many scientists seem to believe,
any
accurate and reliable information regarding an approaching
earthquake can be invaluable. United Nations earthquake
forecasting program personnel would not need to wait until they
had exact details for
when,
where, and
how
powerful an expected earthquake was going to be before
circulating warning data regarding its approach.
Circulate Earthquake Warnings
When appropriate,
U.N. forecasting program personnel would circulate earthquake
warning information to disaster mitigation organizations,
governments, other earthquake forecasting groups, individual
earthquake researchers around the world, and the general public.
Warning information
would be circulated through a variety of resources including
Internet Web sites, E-mail letters, Fax communications, by
telephone when necessary, and even in surface mail letters.
EARTHQUAKE FORECASTING PROGRAM
SUPPORT OPERATIONS
Earthquake Forecasting Program
Structure - A Nonprofit Foundation
Rather
than be created as an agency that was a formal part of the
United Nations, this proposed earthquake forecasting program
might work best if it were organized as a somewhat
independent nonprofit foundation that relied on the United
Nations for support and direction.
The forecasting
program's having a somewhat independent nature might help
protect the program and its employees from being influenced
by and subject to interference from governments and other
organizations. It might also make it easier for
forecasting program management to obtain funding.
Get Funding To Create And Run The Forecasting Program
United Nations personnel
would work with governments and nongovernmental organizations
around the world to secure the necessary funding to create and
run this proposed earthquake forecasting program.
Forecasting Program Expenses
Collecting and processing
earthquake precursor data appears to be a task that is
so
complex and one that
requires so much time and effort
that as proposed earlier on this Web page, it might take as many
as
30 full-time earthquake forecasters plus
support staff to get the job done.
Just to have some numbers to work with:
Perhaps a salary plus
expenses such as future retirement pay for one earthquake
forecaster might be $100,000 U.S. per year. So, it would
cost 3 million dollars a year, U.S., to have 30 professional
forecasters working in this proposed program.
The extremely powerful
March 11, 2011 Japan earthquake was reportedly the most
expensive natural disaster in history. Estimates such as
the ones in the following reports that I have seen proposed that
the earthquake resulted in as much as 300 billion dollars, U.S.,
in damage.
https://uk.news.yahoo.com/2011-japan-earthquake-tsunami-facts-100933886.html
https://uk.news.yahoo.com/2011-earthquake-tsunami-60-powerful-photos-disaster-hit-141113782.html
It would be perfectly
reasonable to expect that far more than 3 billion dollars worth
of damage might have been avoided had that earthquake been
accurately predicted and prepared for.
And so,
That possible 3
billion dollars in savings for just that one
earthquake could have funded this proposed 3
million dollars per year United
Nations earthquake forecasting program for a thousand
years!
For an example of how
tremendous amounts of money might have been saved with just that
one earthquake,
Had people known that the
earthquake was about to occur, all of Japan’s nuclear power
plants could have all been put into an inactive state. And
the one that eventually suffered extensive damage including at
least one reactor core meltdown might have survived relatively
intact. Instead there was widespread land radiation
contamination and one or more radiation-contaminated water
releases to the ocean.
That nuclear power plant
meltdown's consequences were also not just limited to Japan.
The extensive damage
that the nuclear power plant and surrounding area suffered
might possibly have dealt an almost fatal blow to the
international nuclear power industry!
Develop Earthquake Forecasting
Methodology
This would be one of the
most difficult steps related to making this earthquake
forecasting program a success.
As explained elsewhere on
this Web page, perhaps the main thing that has held back the
development of earthquake forecasting programs over the
centuries has been governments’ and earthquake forecasters’
fears associated with the consequences of circulating inaccurate
earthquake forecasts.
When government officials
become aware that an earthquake could be about to occur at some
location they have an obligation to protect people living in
that area. And part of that obligation could at times
involve the evacuation of an entire city.
If the expected earthquake
did not then occur after some city were evacuated, its residents
would be understandably upset. And since at the present
time, it is generally not possible to state with 100% certainty
that an earthquake will occur at some location, in my opinion,
governments etc. have mistakenly chosen to listen to members of
the internationals scientific community who keep insisting that
that “
Earthquakes can’t be predicted.” Our
governments have apparently not made much of an effort to learn
how to make effective use of available earthquake precursor data
or how to circulate and respond to earthquake warning
information.
In order for this proposed
earthquake forecasting program to be a success the earthquake
forecasters running it would need to work with disaster
mitigation organizations, governments, earthquake forecasting
groups, individual earthquake researchers, and the general
public so that all of them would know what they needed to do in
response to an earthquake warning.
That would take
a
lot of work. But it is something that
needs
to be done.
Develop Disaster Mitigation Plans For
Responding To Earthquake Warnings
It is primarily the
responsibility of governments and disaster mitigation groups to
learn how to respond to earthquake warnings. However,
United Nations personnel should develop their own versions of a
variety of disaster mitigation plans that would enable people to
prepare themselves for an approaching earthquake.
That would then enable U.N.
forecasting personnel to better communicate directly with the
general public. And having developed those types of plans
U.N. personnel could provide recommendations to governments and
to disaster mitigation groups etc. regarding how governments
etc. might best respond to earthquake warnings.
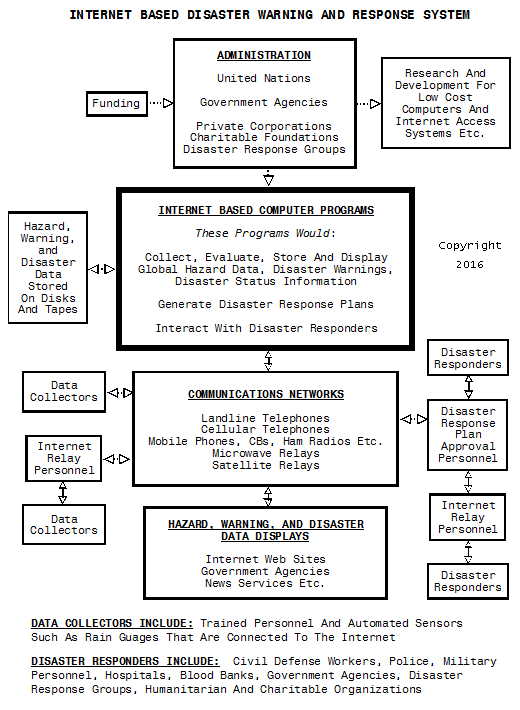
The picture file shown
below demonstrates how a global
Disaster
Response System run by the United Nations might
work. I proposed years ago that such a system should be
developed.
Powerful Internet
Server-based computers would constantly collect disaster-related
information from around the world. When a destructive
earthquake occurred, computer programs running on those servers
would instantly formulate and circulate detailed disaster
response plans.
One of the major advantages
of Internet Server-based disaster response computer programs is
the fact that even when the Internet servers in some country
were disabled by an earthquake, servers located in other
countries could instantly and automatically take over the job of
formulating and circulating disaster response plans.
Work With Earthquake Researchers Around
The World To Develop Better Earthquake Forecasting
Technologies
United Nations earthquake
forecasting personnel would need to work with government,
research group, and independent earthquake forecasters around
the world in efforts to develop more accurate, more reliable,
and more productive earthquake forecasting technologies.
When appropriate, the
United Nations would make research and development
grant
money available to various earthquake researchers.
Also when appropriate, United Nations would simply
pay
researchers through formal contracts to develop certain types of
earthquake forecasting technologies.
Recognizing And Avoiding One Of The
Most Serious Earthquake Forecasting Program Related
Problems
The history of the human
race is littered with the remains of earthquake forecasting
programs that failed. And at least in modern times, many
and perhaps most of them failed for the following reason:
The people running the
earthquake forecasting programs decided somewhat arbitrarily
that they were not going to consider the possible value of
various types of
Earthquake
Precursor data.
The primary goal in
developing earthquake forecasting programs should be saving
lives. And if earthquake researchers can make a profit for
themselves while doing that then I myself don't see a problem
with that. But the goal of saving lives has to come before
the goal of making a profit.
People who try to create
and run effective earthquake forecasting programs need to
consider the potential value of any type of precursor data that
is legally available to them even when their personal
preferences or logic might discourage them from attempting to
evaluate those types of data.
Forecasting program
personnel are unfortunately often unwilling to do that.
This is a widespread, chronic problem that can and probably
often does eventually results in the failure of a given
forecasting program. The earthquake warning data being
generated by the program are never sufficiently accurate.
No one will support the program. The people running it
fail financially. And the program is finally abandoned.
The earthquake precursor
data need to "
speak" for themselves. If certain
types of precursor data are useless then that will eventually
become apparent. When an earthquake researcher decides
that he or she will not even consider certain types of data for
personal or logical reasons then he or she might at the same
time be dooming his or her efforts to failure.
This matter is being
emphasized in this section of this report because United Nations
personnel attempting to create and run an earthquake forecasting
program would automatically be put under a considerable amount
of pressure from the international scientific community aimed at
getting them to refuse to consider evaluating certain types of
precursor data such as the following ones.
UNITED STATES GOVERNMENT EARTHQUAKE
FORECASTING PROGRAMS
Considering the amount of
damage that a powerful earthquake could do here in the United
States, one would think that the U.S. Government would be
anxious to develop the type of forecasting program that I am
proposing the United Nations should develop. However, that
does not appear to me to be the case. In all of the
contacts that I myself have had with U.S. Government personnel
they seemed to me to be highly resistant to the idea of
developing any effective earthquake forecasting programs.
For example, the U.S.
Geological Survey agency is part of the U.S. Department of the
Interior. And years ago I wrote to the U.S. Secretary of
the Interior and stated that my data were indicating that
certain types of electromagnetic energy field fluctuations might
be good indicators of approaching earthquake activity. The
formal written response that I eventually received stated that "
You
have to Prove in published papers accepted by the
scientific community that earthquakes can be predicted before
we will pay any attention to what you are telling us."
Other communications that I
have had with U.S. Government personnel and communications that
other people have had with them have resulted in somewhat
similar responses.
What those types of
responses indicate to me is that the attitude of U.S. Government
officials is that in spite of the chaos and destruction a
powerful earthquake could cause here in the U.S., government
officials have relatively little intention of spending
substantial amounts of time, money, and effort on attempts to
determine if earthquakes can be predicted.
I don't know if the U.S.
Government could actually run an effective earthquake
forecasting data evaluation program because of all of the
politics that would be associated with such a program.
Perhaps it would be possible to get them to run some tests on
specific types of forecasting technologies such as that
Sun Shadow based method discussed on
this Web page, or a program that makes use of the types of
EM Signals that I myself work with.
EARTHQUAKE FORECASTING PROGRAMS
IN JAPAN AND OTHER COUNTRIES
(How To Develop Earthquake
Forecasting Programs)
Of the various world
governments and government scientists that I have personally had
any direct or indirect contact with, I have found that India
Government officials and scientists seem to be the most
interested in developing earthquake forecasting programs.
They have also in my experience been the most open to
unconventional ideas such as working with astrologers who might
be interested in attempting to predict earthquakes.
However, there is something
that can hinder efforts to develop earthquake forecasting
technologies in India and most other countries. And that
is the fact that earthquakes do not occur that often in a given
area in India and elsewhere.
When developing
technologies such as ones used to predict earthquakes it can be
easier when there are large numbers of earthquakes (or whatever)
in a specific area during a relatively short period of
time. That makes it easier to determine which technologies
will work and which ones are not worth the effort. If the
people attempting to develop a particular forecasting method
have to wait ten years for an earthquake to occur so that they
can see if the method works then they are likely not going to
get too much accomplished in a short period of time.
For the reasons listed
below:
Perhaps the best
place to work for people who wish to test their earthquake
forecasting methods would be in Japan.
--- Earthquakes of various magnitudes occur constantly in
the Japan area. So, there can be almost limitless numbers
of opportunities there to see if a given earthquake forecasting
method has a chance of working.
--- Virtually every type of earthquake occurs in the Japan
area. That includes ones that are associated with tectonic
plates that are attempting to slip sideways past one another and
ones that are associated with tectonic plates that are colliding
with one another. So, there is the opportunity to see if a
given forecasting method will work for those different types of
earthquakes.
--- In the Japan area there are inland earthquakes and
ones that occur out in the ocean. So a given forecasting
method could be tested to see if it would work for earthquakes
occurring in both locations. Some methods would probably
not work with earthquakes that occur far out at sea.
--- Japan is a technologically developed nation. And
earthquake researchers working there would have easy access to
electric power, to the Internet, and to transportation
resources. In contrast, it can be difficult to get
permission to freely enter or leave some countries. In
other cases, even being
in a given country at the wrong
time could be dangerous for earthquake researchers.
--- Since earthquakes occurring in the Japan area can be
so destructive it would seem logical to me at least that Japan
Government officials would be supportive of efforts made by
visiting researchers who were attempting to develop earthquake
forecasting technologies.
If other earthquake
researchers agree that it would seem logical to see if various
forecasting methods will work in the Japan area then I would be
interested in hearing from them. Additionally, researchers
might want to contact Japan Government officials directly and
recommend that they attempt to encourage researchers to visit
Japan and see if various forecasting methods will work for
detecting the approach of Japan area earthquakes.
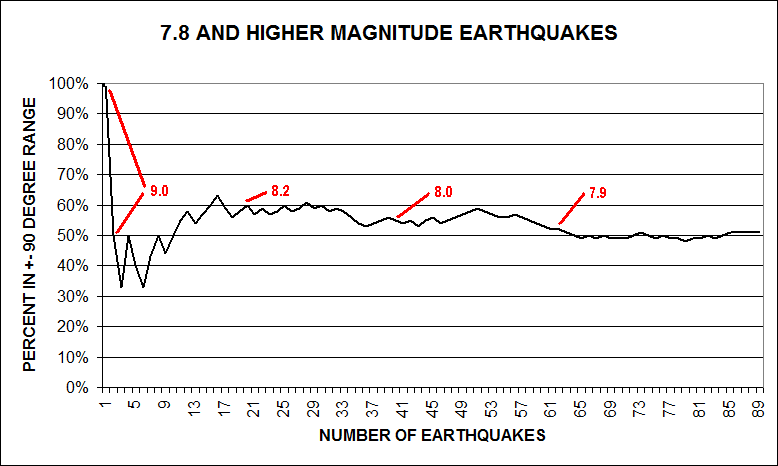
A NUMBER OF EXISTING AND
PROPOSED EARTHQUAKE FORECASTING PROGRAMS
Some groups and individuals
doing earthquake forecasting work are not presently active on
the Internet. Their data are often being circulated by
E-mail.
The following sections of
this
Breakthroughs Web page provide some details
regarding existing or proposed formal or informal earthquake
forecasting programs.
So many different types of
earthquake forecasting methods have now been developed that not
only would it be impossible to discuss them all here, it is not
even possible to keep track of how many have been
developed. Just a relatively small number of them are
being reviewed on this Web page. A number of others are
discussed on the
NCGT
Journal Earthquake Precursor Data Web page.
Information regarding many other forecasting methods can be
found in the literature and through Internet searches.
An EM Signal based
forecasting method is being discussed first so that people can
become familiar with the subject of
Predicting
Earthquake Aftershocks, something that is already
being done to some extent through the use of that forecasting
method.
AN EM SIGNAL BASED
FORECASTING METHOD
This part of this Web
page contains information regarding a complex earthquake
forecasting method that is largely based on the detection and
evaluation of certain unusual electromagnetic energy types of
signals (
EM Signals). Most often
the EM Signals have durations of only about 20 seconds.
The following Web pages
were created in part so that people around the world could use
the data generated in connection with this forecasting method to
predict their own earthquakes, especially earthquake
aftershocks:
Data.html
Data-2.html
Data-3.html
Those Web pages are
also intended to provide earthquake researchers around the world
with unique types of data regarding events that are taking place
in earthquake fault zones around the world both before and after
the times when significant earthquakes occur.
Theories associated
with this forecasting method are discussed in this first part of
this Web page section. The second part explains how to
interpret the earthquake forecasting computer program-generated
data. And the third part discusses extensions of this
forecasting method that should make it possible to use the
method to generate more accurate and timely earthquake
forecasting data.
With time,
additional information will likely be added to this EM
Signal-related section of this Web page.
Theories that are presently
being evaluated propose that the EM Signals that I am personally
working with are associated with temporary, strong fluctuations
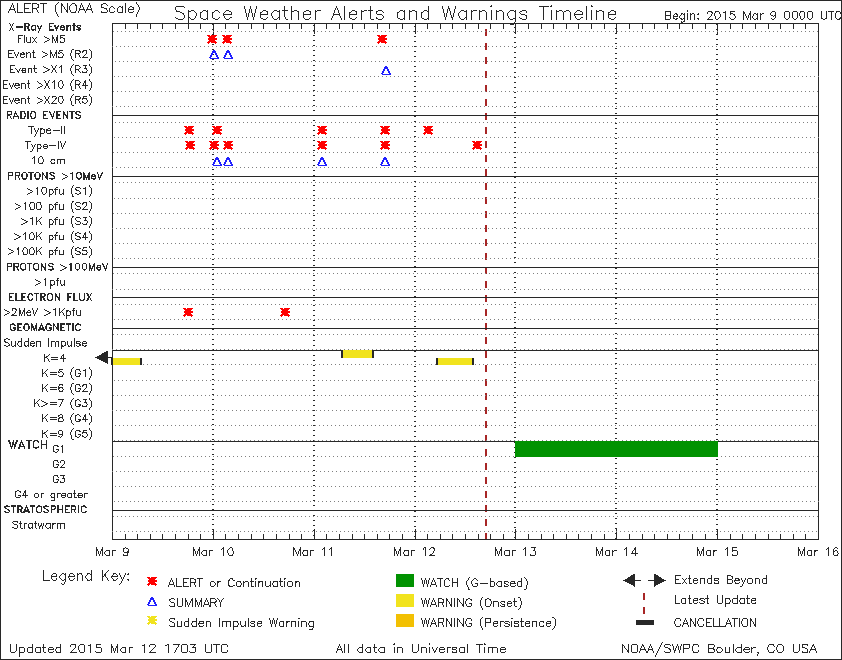
in the Earth's geomagnetic energy field. And as the chart
below shows, NOAA data are supportive of that. This chart
has been copied from the
http://www.earthquake-research.com/archive/2015-03-29-PNG.html
Web page that discusses links between earthquakes and a number
of earthquake precursors.
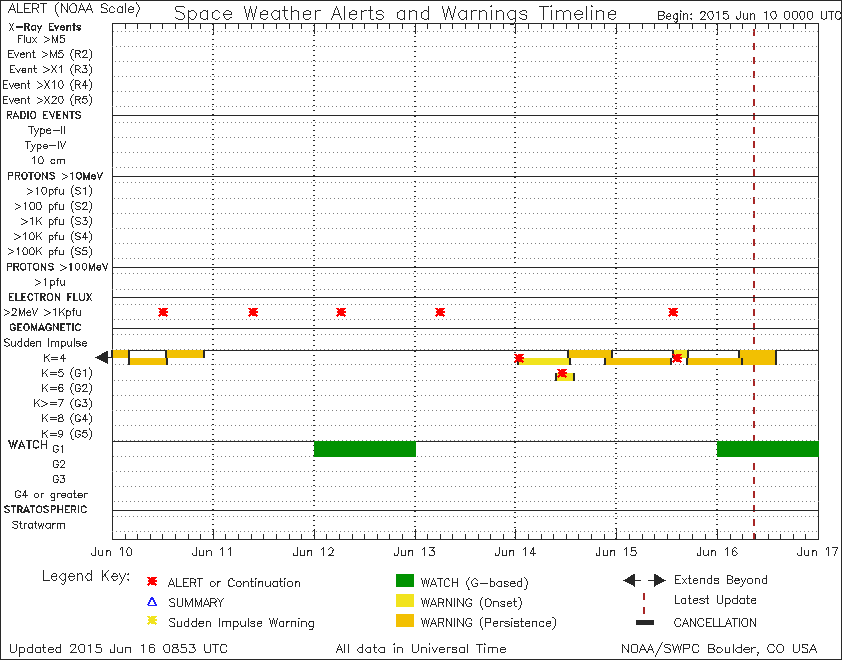
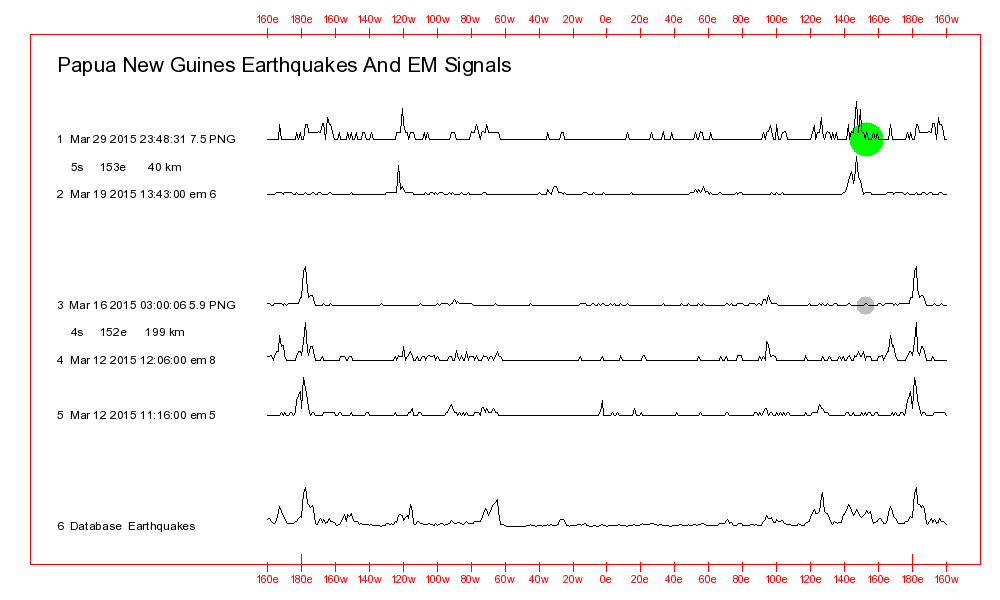
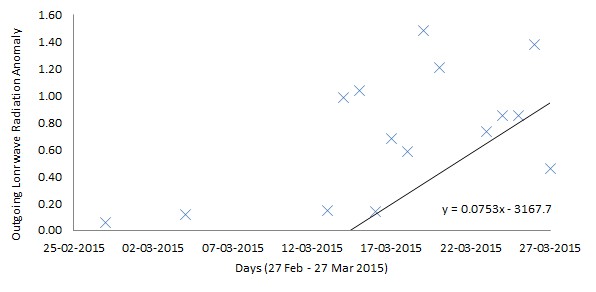
A high intensity EM Signal
was detected at 2015/02/28 17:53:00 UTC, the same time that the
chart shows that there was a geomagnetic storm alert (See the
red K = 4 rectangle).
However, in contrast, quite
often, strong EM Signals are still being detected when there is
no geomagnetic storm activity.
The times when some
of the EM Signals that I work with will be detected can be
predicted by examining the following Web page.
http://www.swpc.noaa.gov/products/space-weather-advisory-outlook
Apparently, when certain
types of solar storm energy hit the Earth their energy can cause
earthquake fault zone activity in areas where earthquakes are
getting ready to occur to result in some of these EM Signals
being generated.
It is not presently known
by me how widespread the EM Signal-related geomagnetic energy
field fluctuations are. Although these particular EM
Signals can apparently be detected before powerful earthquakes
occurring around the world including ones occurring deep under
the ocean floor, there are no data available regarding whether
or not the energy field fluctuations are confined to certain
parts of the world at a given time such as along certain
latitude or longitude lines, or if they can be detected at all
locations around the world at the same time.
These EM Signals
appear to also at times have strong links with volcano
activity. EM Signals associated with volcano activity
appear to be stronger than ones associated with approaching
earthquake related activities.
Theories being presently
evaluated propose that the EM Signals are being generated when
the rock layers in earthquake fault zones undergo abrupt,
temporary changes in their electrical resistance. During
perhaps a 20 second period of time, energy stored in or above
the atmosphere, at times associated with solar and geomagnetic
storms, pours into the earthquake fault zone over a wide area
resulting in the geomagnetic energy field disturbances.
Those events can be thought
of as something like a very wide diameter bolt of lighting.
Competing theories propose
that the geomagnetic energy field disturbances actually result
from underground electric currents circulating through the fault
zones. And atmospheric processes etc. above the fault zone
are not originally responsible for those currents.
Another, dramatically different EM Signal generation theory is
also being evaluated. It is not being discussed
here. It is still in the development stages.
It is presently believed by
me that the
atmospheric sources of energy mechanism
is likely the primary one for these EM Signals.
My data indicate to me that
these EM Signals are being generated before most or all of the
powerful earthquakes that are occurring around the world.
And it might be possible to use triangulation technology to tell
exactly where the signals have their origins. That
information would likely then enable us to reliably detect the
approach of many of our significant earthquakes making this
particular forecasting method perhaps the most powerful and
useful forecasting method in existence.
The following two
computer program-generated charts show the potential importance
of these EM Signals. The charts display some of the
signals that were detected before two fairly recent, incredibly
destructive earthquakes. EM 9 would be the highest
intensity EM Signal.
The similar line shapes
between the earthquakes and the EM Signals are likely indicating
that these signals were pointing to the approach of
both
earthquakes for
months before either of them
occurred. Had it been possible at those times to more
accurately interpret the EM Signals and warn people about the
approach of the earthquakes, tremendous numbers of lives might
have been saved.
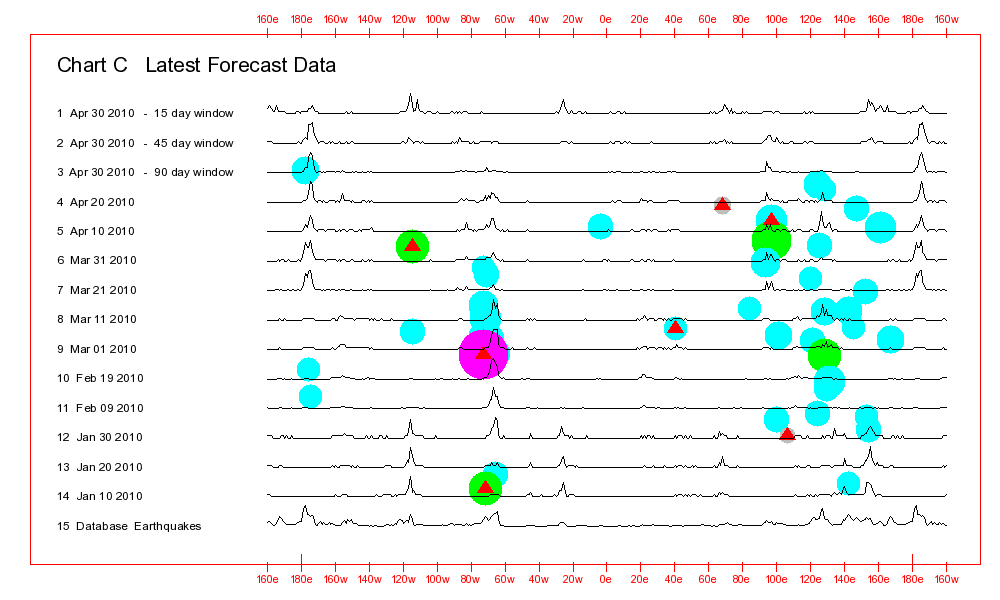
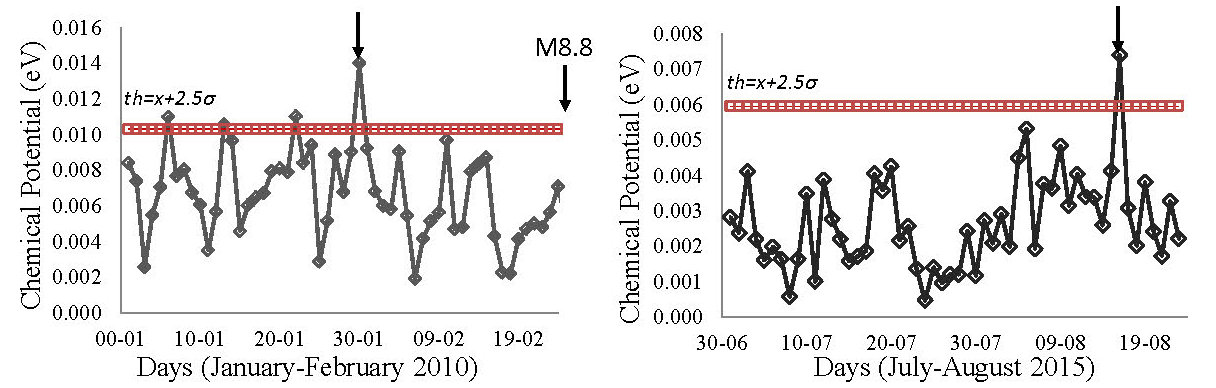
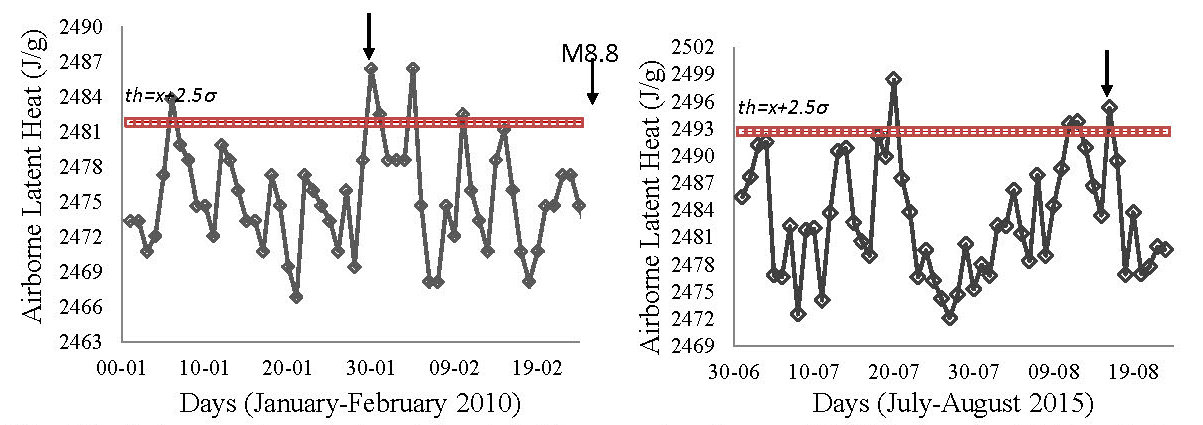
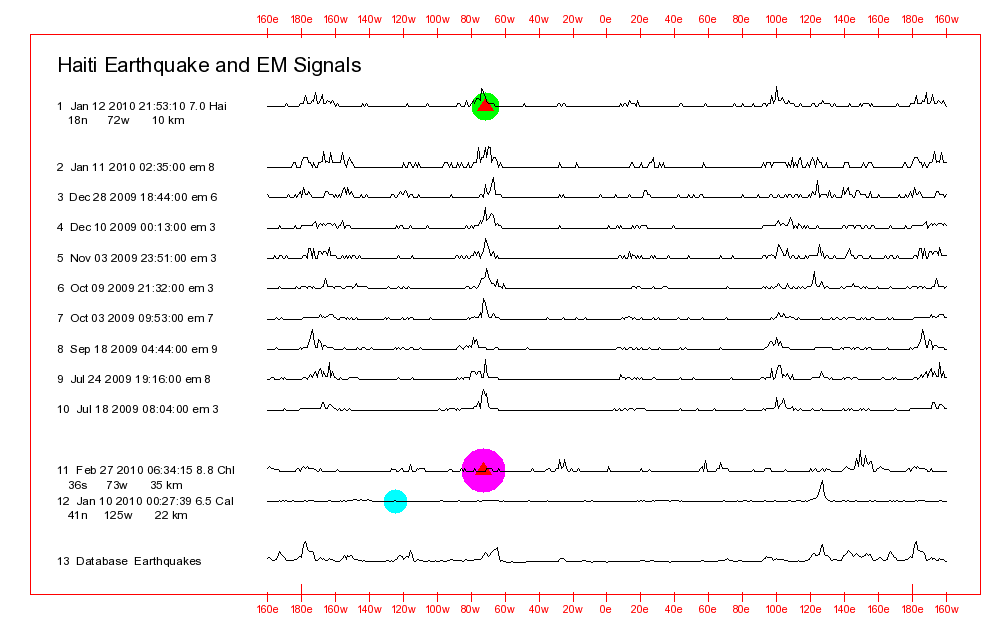
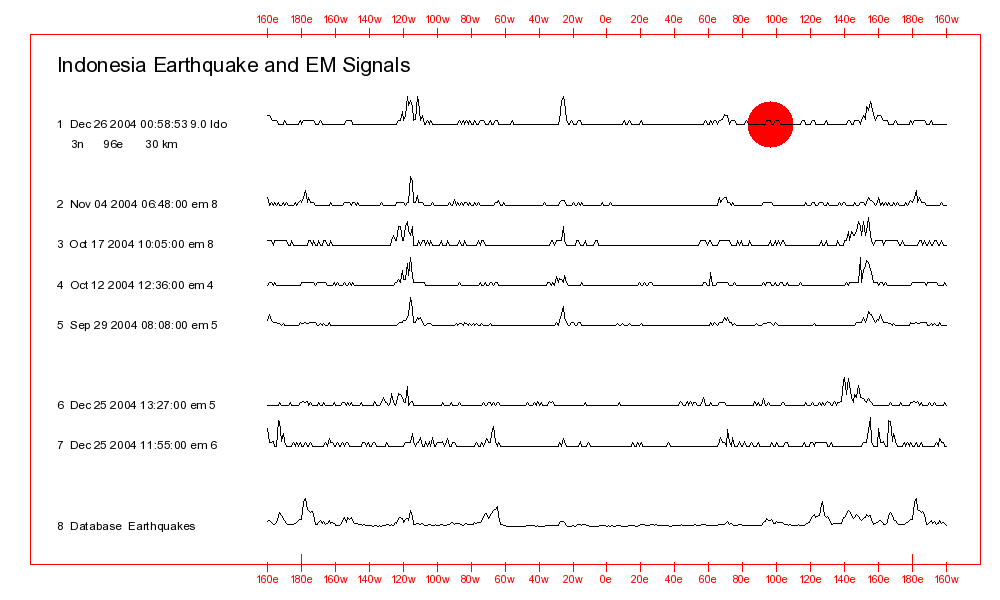
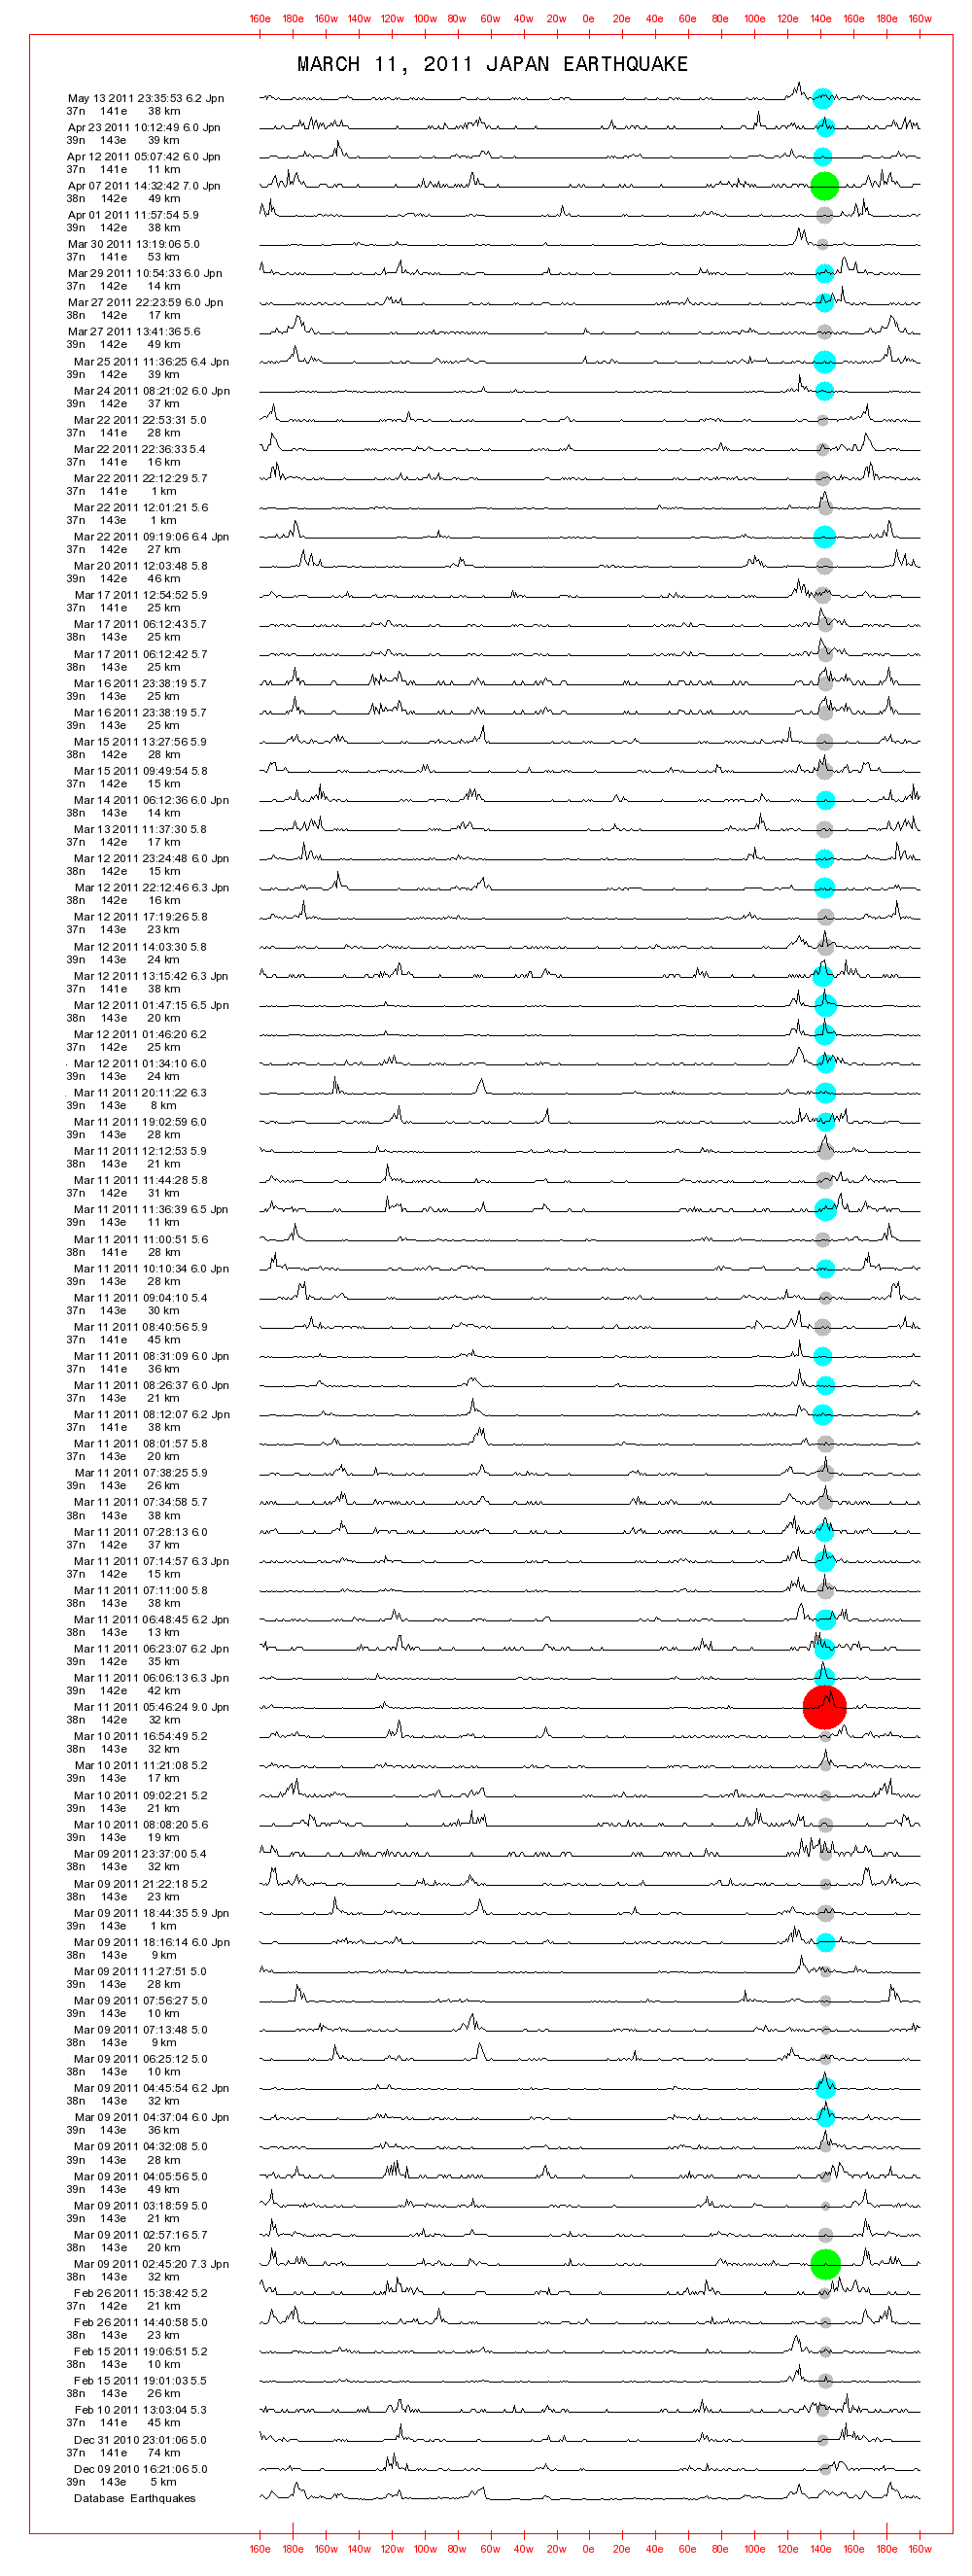
The first chart is for the
January 12, 2010 Haiti earthquake. Two additional
significant earthquakes have been added to the chart to show
that the EM Signals did not match either of them.
2010/01/12 21:53:10 18.45N 72.44W 10 7.0
Haiti Region
The detection of the high
intensity January 11, 2010 EM Signal would be consistent with
the detection of strong EM Signals on the morning of the
earthquake by the
Earthquake
Sensitive Haiti resident.
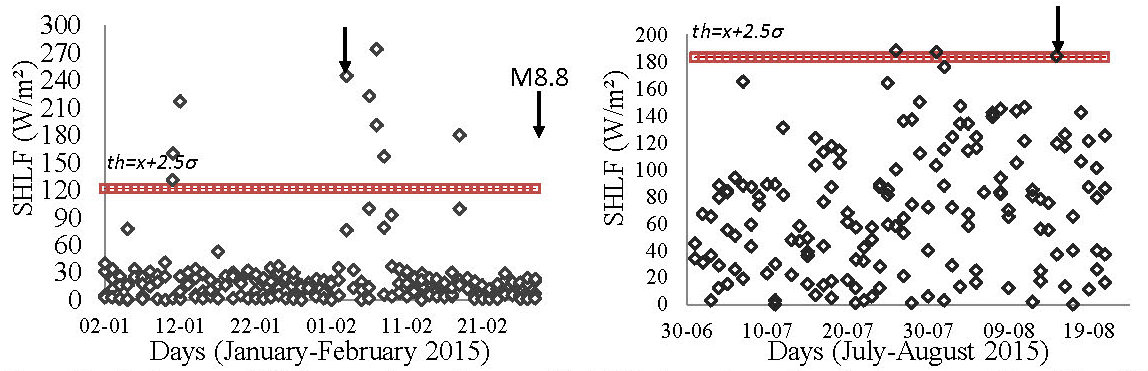
The chart below is for the
equally destructive December 26, 2004 Indonesia earthquake.
2004/12/26 00:58:53 3.30N 95.87E 30 9.0
Indonesia
Although the Line #s 6 and
7 EM Signal line shapes are not high quality matches for the
earthquake, the signals were detected during the 24 hour time
period before the earthquake occurred. And that suggests
to me that they were likely associated with the earthquake's
approach.
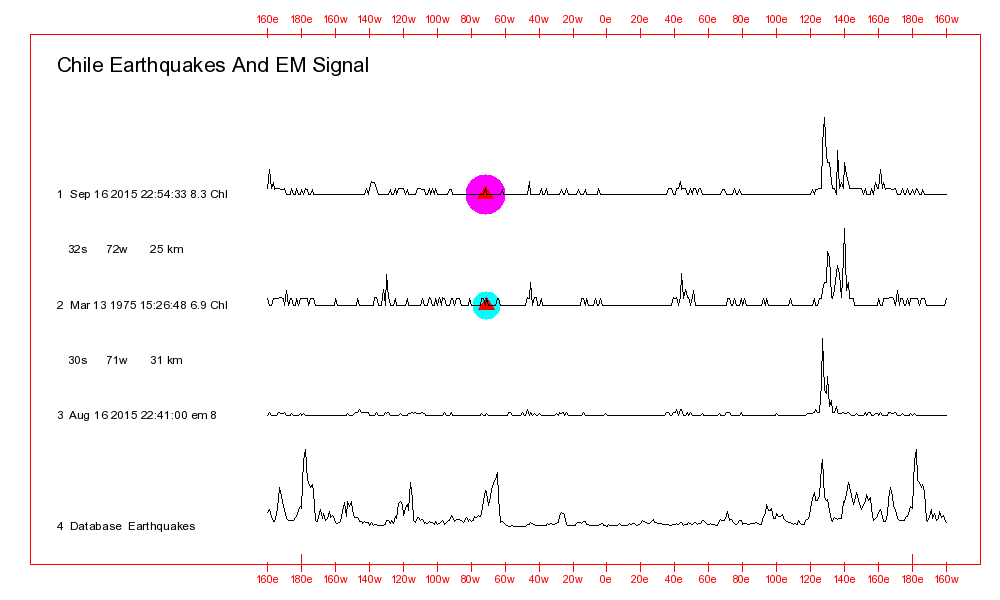
As another chart on this Web page
shows, EM Signals were being detected for about a year and a
half before the 8.3 magnitude September 16, 2015 Chile area
earthquake. And a different type of EM Signal was being
detected for a good nine months before the 9.0 magnitude March
11, 2011 Japan earthquake.
Unfortunately, I myself do
not have any scientific instrumentation capable of doing the
type of triangulation work that might make it possible to
determine where the EM Signals have their origins. Instead
as the above charts show, I am using complex probability-related
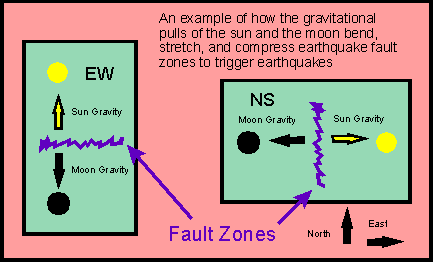
computer programs to compare sun and moon gravity-related forces
existing at the times when EM Signals are detected, with similar
data for past earthquakes. When those computer programs
are able to match an EM Signal with a past earthquake then that
can be an indicator that another earthquake is getting ready to
occur at that same location.
That probability-related
computer program approach to determining where the EM Signals
have their points of origin does produce some accurate and
useful results, especially with the detection of approaching
earthquake aftershocks.
Additional information
regarding the nature of these EM Signals can be found on
http://www.earthquake-research.com/eqf/Charts.html,
Data.html,
Earthquake Triggering, Earthquake
Precursor Signal Generation, and Earthquake Sensitivity
Theory Pictures, and other Web pages.
PART 2 - INTERPRETING THE DATA
The relatively simple
earthquake forecasting
Table Data that can be found
on the
Data-2.html
and
Data-3.html
Web pages have already been discussed in the
Data Evaluation Procedure # 2
section of this Web page.
The following is a
detailed discussion of how to interpret the
Chart Data
that can be found on the
Data.html
Web page. The discussion focuses on the following
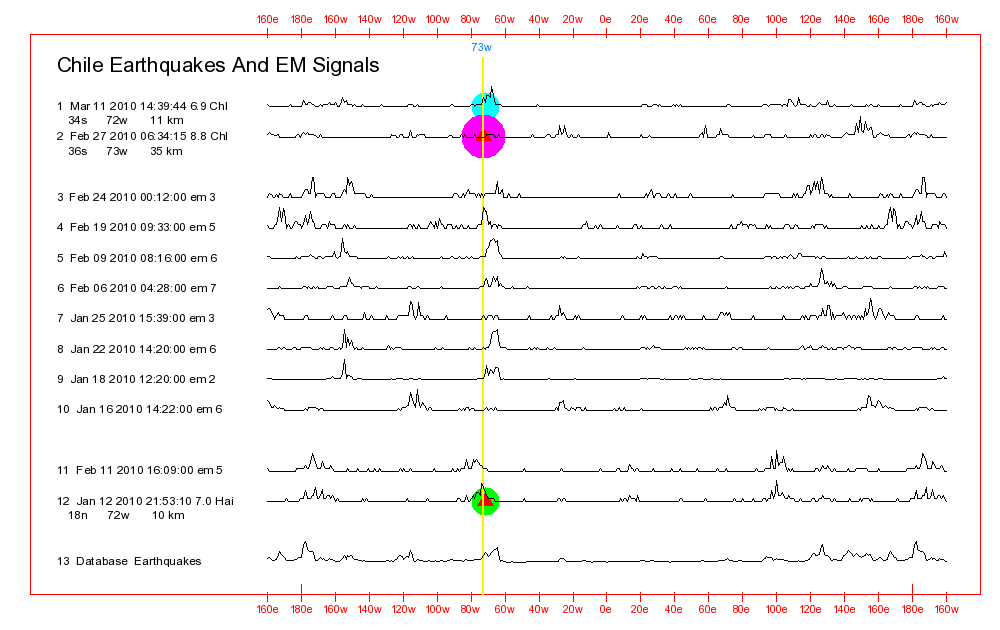
powerful and destructive September 16, 2016 Chile area
earthquake:
2015/09/16 22:54:33 31.57S 71.65W 25 8.3 46km
West of Illapel, Chile
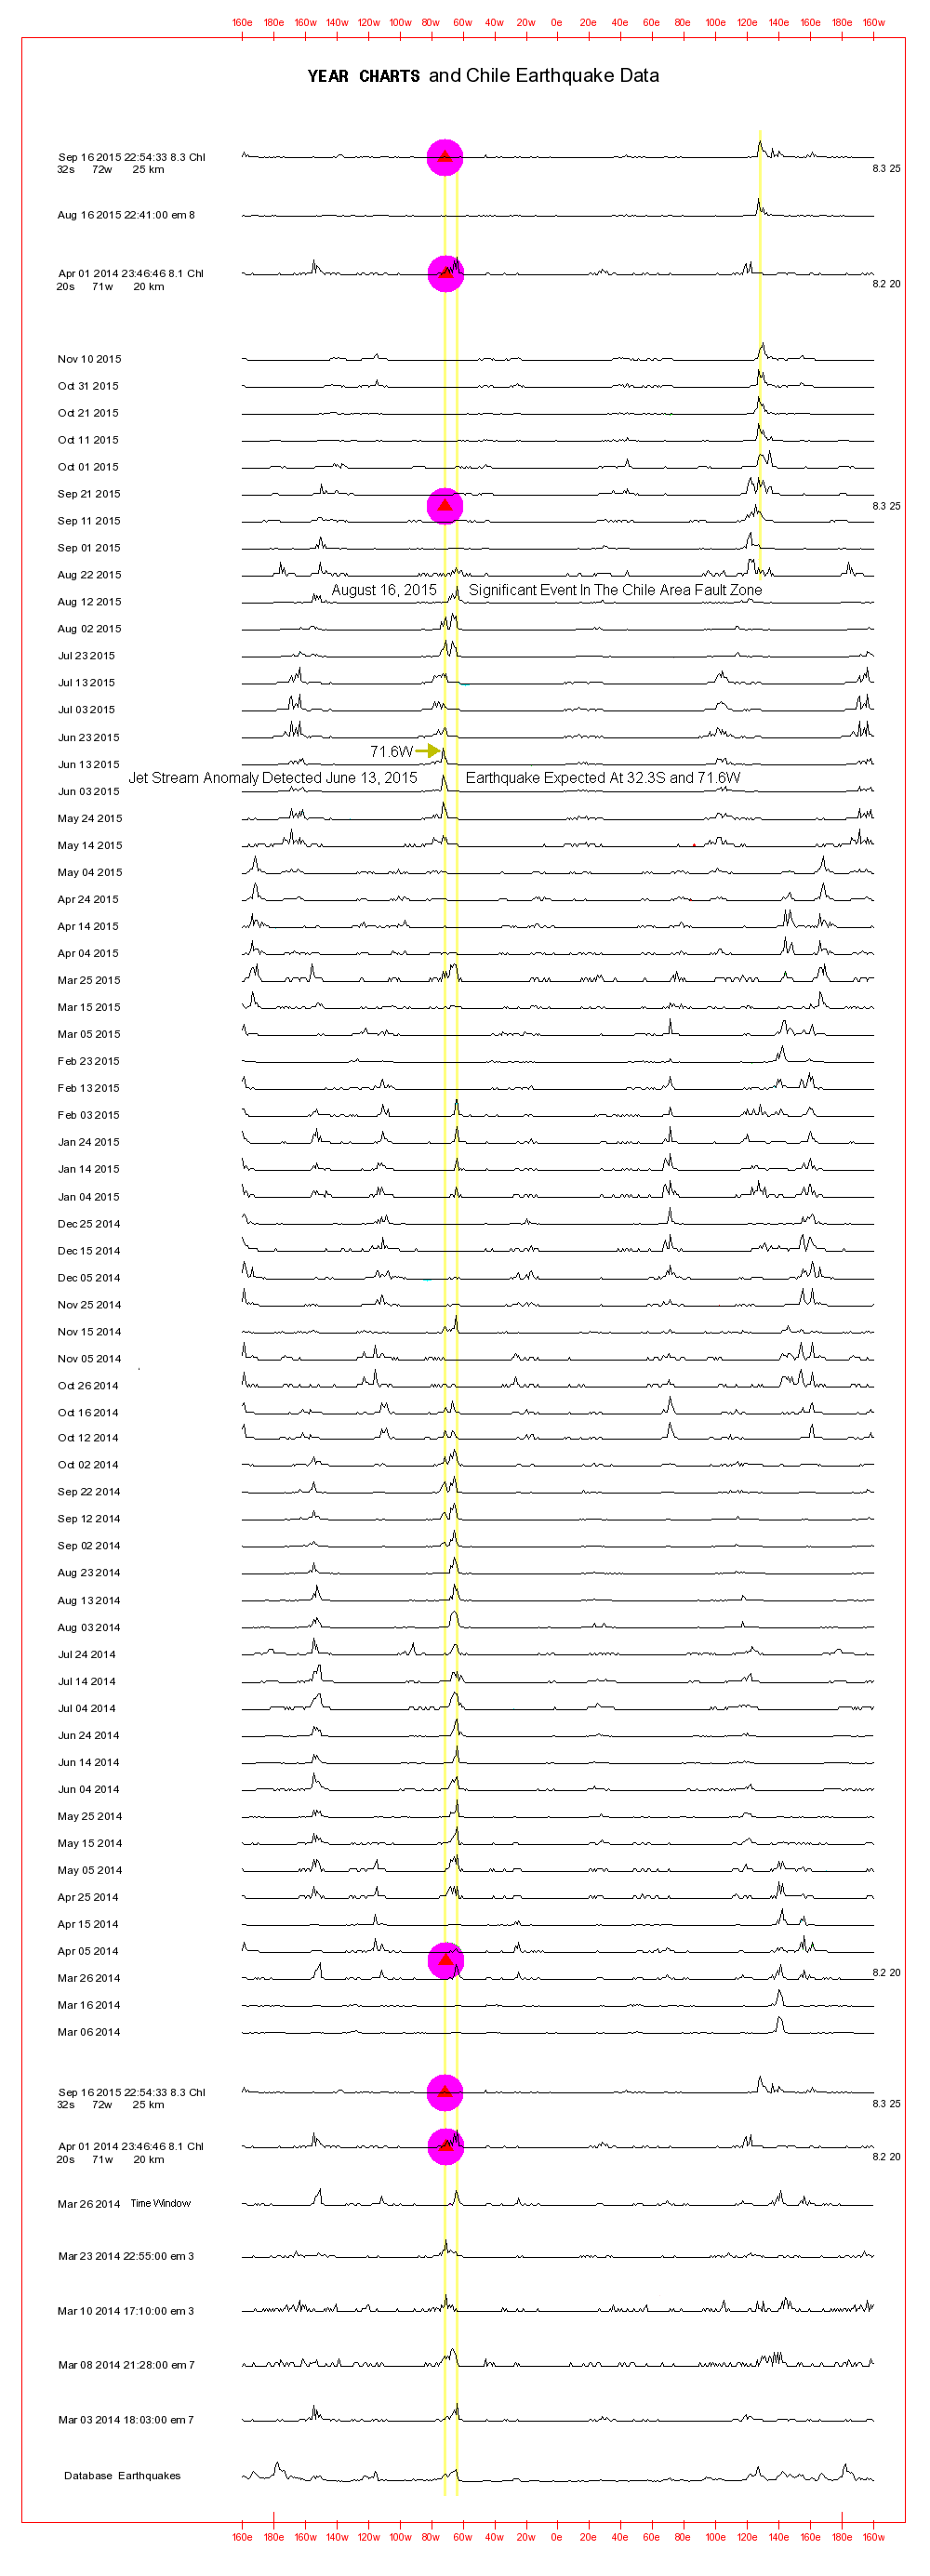
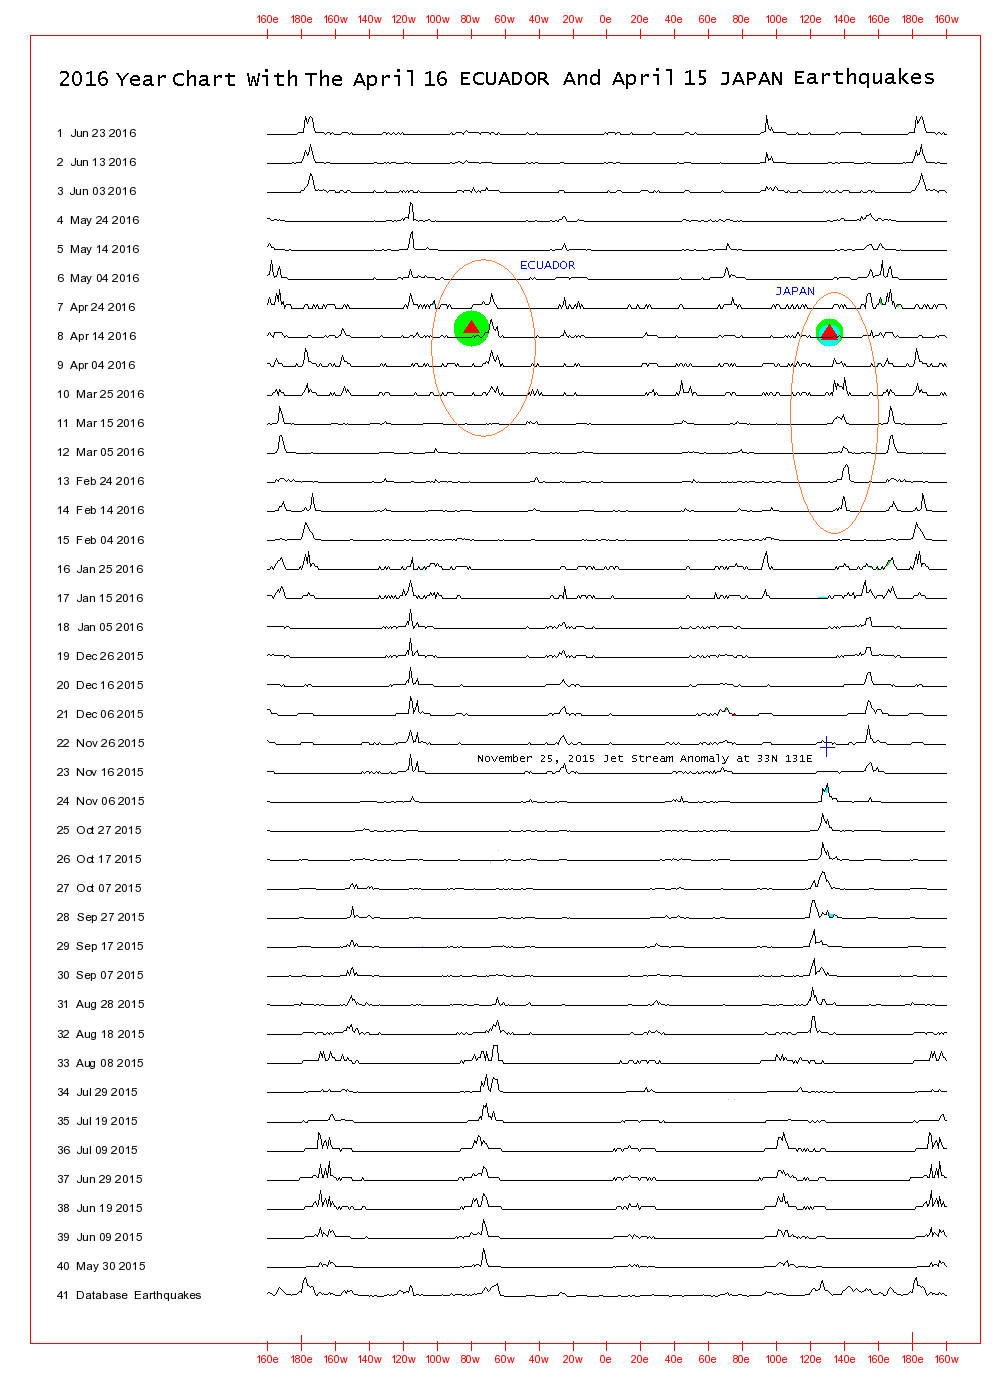
Chart Data Explanation
A good way to to read the
information in this section of this Web page might be to open
two Web page browser windows. The first one could be used
to display the above chart. The second could be used to
read the text information in this section. And
Alt Tab
could be used move back and forth between the two windows.
On the
Data.html
Web page there are several
Year Chart For The Year 2016
picture files. They display
Time Window Averaged
EM Signal Data for the year 2016 and most of 2015.
Also on that Web page there are several
Year Charts For The
Years 2001 Through 2015 picture files. The above
chart is from the
Year Charts. Several EM Signal,
earthquake and Time Window lines have been added for explanation
purposes.
Averaged EM Signal Data -- That means that
each Time Window line on the chart represents 90 days
worth of EM Signals averaged together. The last day during
that Time Window is the date on the Time Window line. The
Time Window lines are offset from one another by 10 days.
Line Peaks - Where there is a line peak at
some longitude on any of those Time Window chart lines it means
that my computer programs determined that sun and moon gravity
related forces associated with the averaged EM Signals during
that Time Window were similar to sun and moon gravity related
forces that existed at the time when past earthquakes occurred
at that longitude. The earthquakes used for those
comparisons were mostly 5 and higher magnitude earthquakes going
from the present back to the start of 1973.
Circles Or Dots - The purple circles or dots
on the upper Chile earthquake line and the lower
Year Chart
part of the above chart show the longitude and relative
magnitude (circle size) of the earthquake. A red triangle
within one of those circles shows that there was at least one
fatality associated with the earthquake.
Numbers On The Chart - The number to the
left of the earthquake date show the magnitude of the
earthquake. Those below that line show show the latitude,
longitude, and depth of the earthquake. And the ones on
the right side of the
Year Chart part of the chart show
the magnitude and depth of the earthquake.
OBSERVATIONS AND THEORIES
The following is an
interpretation of the various EM Signal, Time Window, and
earthquake lines and other data on the above chart.
The August 22, 2015 Time Window Line Peak Longitude Shift
- As discussed in a fair amount of detail in the
Multiple
Earthquake Precursors Data Evaluation Forecasting Method
section of this Web page, around August 16, 2015, the Chile
Seismos earthquake forecasting group detected earthquake
precursor signals that they concluded were probably indicating
that a powerful earthquake could be headed for the Chile
area. And they circulated a formal Earthquake Warning.
As can be seen on the above
chart, the Time Window line peaks made a dramatic shift in their
longitude positions from 65 W to 72 W locations to around 125 E to
130 E at that same time. On August 16, 2015 I myself also
detected a very high intensity EM Signal. The line peak
profile for that EM Signal can be seen near the top of the
chart. And it can also be seen that the line peak profile
for that EM Signal looks fairly similar to the line peak profile
for the September 16, 2015 Chile area earthquake.
Question: What was responsible for that line peak
longitude shift from 65 W to 72 W locations to around 125 E to
130 E roughly one month before the Chile earthquake?
It is my interpretation of
those data that around August 16, 2015 there was some type of
significant event in the Chile fault zone where the approaching
earthquake was going to occur. And that event was
responsible for the precursor signals that were detected at that
time by the Chile Seismos group. And it caused the EM
Signals that I myself work with that were being detected from
that time on to have sun and moon gravity related forces
associated with them that more closely resembled the sun and
moon gravity related forces associated with earthquakes that had
occurred in the past around 125 E to 130 E rather than earthquakes
that had occurred in the past around 65 W to 72 W.
That significant event in
the Chile area fault zone might have involved the rock layers in
the fault zone abruptly changing their electric
resistance. And that resistance change might have been
associated with an abrupt shift in the manner in which the two
earthquake fault zone tectonic plates were oriented towards one
another. Forces being exerted on them might have suddenly
increased or changed direction. Or the two tectonic plates
might have been suddenly "twisted" relative to their previous
orientation towards one another.
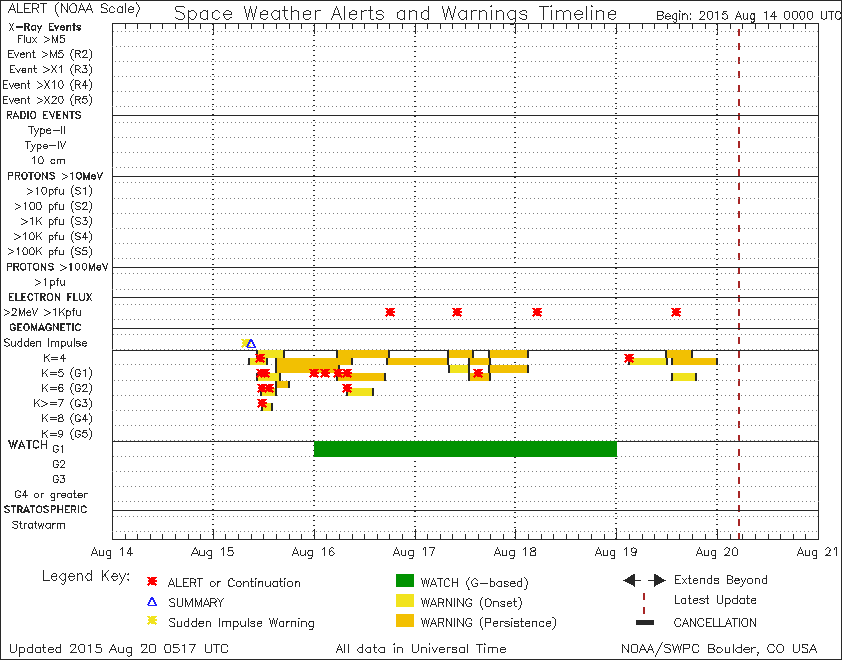
The NOAA chart shown below
also suggests that the significant event might have been linked
in some way with the geomagnetic storm activity around August
16, 2015.
Whatever that
significant event was, one its consequence appears to have been
to cause the location of the strong line peak on the Time
Windows a month before the earthquake to shift from around 70 W
to around 125 E. The EM Signals being generated and
detected were still associated with events taking place in the
Chile area fault zone. But their line peak locations on
the Time Window lines no longer pointed to the right longitude
for the approaching earthquake.
The repeated appearance and
disappearance of line peaks at some longitude is discussed in
detail in the
Line Peak Appearance
And Disappearance section of this Web page.
The June 23, 2015 Line Peak Longitude Shift -
It can also be seen that around June 23, 2015 there was an
earlier Time Window line peak shift. They temporarily
moved from the 65 W to 72 W area to around the 165 W area.
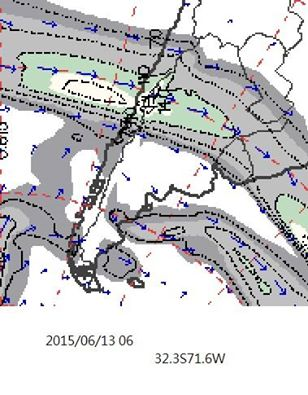
And as noted on the chart, there was a strong Jet Stream anomaly
detected on June 13, 2015 and a geomagnetic storm on June 14,
2015.
It is my interpretation of
those data that there was some type of dramatic event in the
September 16, 2015 Chile earthquake fault zone around the middle
of June just as there was in the middle of August. And
that event led to the appearance of that Jet Stream anomaly and
also to my chart's June Time Window longitude shift.
The March 26, 2014 Time Window
Line - At the bottom of the chart there is a
line peak around 65 W on the March 26, 2014 Time Window
line. And that line peak is a fairly good match for the
line peak at the same location on the April 1, 2014 Chile
earthquake line. The earthquake reportedly claimed about a
half dozen lives. So, that Time Window line peak that
could be seen on the chart about a week before the earthquake,
was likely accurately indicating that a significant earthquake
was approaching for some fault zone located around 65 W.
The March 3, 8, 10 And 23, 2014 EM Signal Lines
- They have line peaks in the 65 W to 72 W area. And
those EM Signals are likely responsible for the 65 W to 70 W March
26 Time Window line peak. Had the
Multiple
Earthquake Precursors Data Evaluation Forecasting Method
been in use when the signals were detected then it might have
been possible to use them plus the March 26, 2015 Time Window
line to tell that the April 1, 2014 Chile earthquake was
approaching.
The April 2014 To August 2015 65 W To 72 W Chart Line Peaks
- There are line peaks in that range starting at April 25,
2014 and going, on and off, to August 23, 2015. Those data
are consistent with data reported by other earthquake research
personnel.
My
interpretation of those data is that shortly after the April 1,
2014 earthquake occurred in the Chile area strain started to be
shifted to the location where the September 16, 2015 earthquake
was getting ready to occur. And EM Signals started to be
generated that were indicating that the September 16, 2015
earthquake was approaching.
So, for roughly a year
and a half before the September 16, 2015 Chile earthquake
occurred, the Data.html
chart data were accurately indicating that a powerful
earthquake could be about to occur somewhere along the 65 W to
72 W longitude lines.
The Repeated Appearance And Disappearance Of The 65 W To 72 W
Chart Line Peaks Between April, 2014 And August, 2015
Question: Why did the 65 W to 72 W longitude line
peaks repeatedly appear and disappear during that time period?
Possible Answers:
During those times when
there were no line peaks between 65 W and 72 W:
Theory # 1 - The "working" assumption that the
65 W to 72 W line peaks on the chart were accurately indicating
that the September 16, 2015 Chile earthquake was
approaching is correct. But the EM Signals were actually
being generated by some other 65 W to 72 W fault zone
system such as the one associated with the April 1, 2014 Chile
earthquake.
That first theory is
looking increasingly attractive with time.
It is possible that the EM
Signals during that year and a half period of time before the
September 16, 2015 Chile earthquake were being generated in
fault zones in the 65 W to 72 W area. But the September 16,
2015 earthquake fault zone itself might actually have been
generating signals for just a few months before the earthquake
occurred. The earlier EM Signals were being generated
elsewhere along those longitude lines.
Additional data analyses of
my EM Signals and comparisons with data from other researchers
could probably be used to determine exactly what was taking
place and when it was taking place with regard to that first
theory.
Theory # 2 - There were no line peaks in the 65 W
to 75 W area at certain times because conditions in the Chile
fault zone were such that no signals would be generated even
though the September 16, 2015 earthquake was
approaching. For example, the necessary strain was not
present during those times when there were no line peaks
visible.
Theory # 3 - Conditions in the fault zone
were such that signals would have been generated if an
external energy source were active. But there were no
such external energy sources active. For example, there
might have been no solar or geomagnetic storms at those times
that could have served as external energy sources.
Theory # 4 - Chile fault zone-related
signals were constantly being generated. But for one
reason or another, at certain times they pointed to the wrong
longitudes.
Theory # 5 - Chile fault zone-related
signals were being generated. But during those times
when they could not be seen in the 65 W to 72 W area there were
stronger signals being generated by approaching
earthquakes that were going to occur in other fault
zones. So the line peaks associated with the Chile fault
zone were essentially too small to appear on the chart.
My computer programs
normally amplify the largest line peak associated with each Time
Window so that it is "full scale." And the amplification
factor used for that Time Window correction is then applied to
all of the other line peaks in that Time Window. As a
consequence, if Chile fault zone-related line peaks had a height
of 10 and there were no other larger line peaks for a given Time
Window then the Chile fault zone related-ones would be displayed
as the strongest line peaks. However, if an earthquake
fault zone at some other location started generating signals
that produced line peaks having heights of 100, then after the
amplification factor for a given Time Window was applied to all
of the peaks in that Time Window, the Chile fault zone height 10
line peaks would disappear from the chart. After the other
earthquake occurred the Chile fault zone line peaks would start
to appear again.
At this point, a good
question would be,
"
If there is so many
verifiable data available such as those Chile earthquake data
that clearly prove that earthquakes can be and are
being predicted, why aren't governments, NGO personnel,
and earthquake researchers in the international scientific
community predicting significant earthquakes for us?"
The answers to that
question are fairly complex. Some of them are discussed in
this Web page's section titled
Why Governments Can't
Predict Earthquakes.
PART 3 - ADDITIONAL EM
SIGNAL INFORMATION AND APPLICATIONS
The following EM
Signal-related sections of this Web page are relatively
short discussions of a number of specialized topics and
applications associated with the EM Signals that I myself
work with.
3.1 - Natural Versus Artificially Generated
EM Signals
As stated earlier in
this section of this report, theories that I am presently
checking propose that the EM Signals that I work with are
being generated when there is some type of electromagnetic
activity at specific times in earthquake fault zones where
earthquakes are getting ready to occur. The resistance
of the fault zone rock layers might be changing for short
periods of time. And in some cases at those times,
solar and/or geomagnetic energy pours into the fault zone
over a large area causing EM Signals that I work with to be
generated. Those signals usually have durations of
perhaps 20 seconds.
Back in 2014 I
circulated an E-mail report related to that subject matter
to earthquake researchers around the world. The report
proposed that if those fault zone rock layer resistance
changes are taking place on a regular basis before
earthquakes occur, then it might be possible to detect them
without having to wait for a solar or geomagnetic storm.
Some type of low power
radio signal could be transmitted into the ground near
earthquake fault zones. And when those brief fault
zone rock layers resistance changes occurred the radio waves
would be suddenly and temporarily absorbed by the rock
layers. And that absorption phenomenon could be
detected with the right types of sensors.
The following is the
Internet Web site address for a SCIENCE CHINA Earth
Sciences 2015, 58: 172-182 paper that describes a technique
for doing exactly what I proposed. Their energy source
is an Extremely Low Frequency (ELF 0.1 to 300 cycles per
second) radio transmitter that has transmission lines
hundreds of kilometers long.
http://www.eurekalert.org/pub_releases/2015-03/scp-aoa030915.php
It is my expectation
that the Mainland China forecasting system discussed in that
paper had its origins in the E-mail report that I circulated
back in 2014. For one thing, the only data that I am
aware of that have ever been generated that would suggest
that such a forecasting system could even be developed are
the EM Signal data that I myself am generating. So,
researchers in Mainland China would not have any other basis
for even proposing that such a system could be developed and
made operational.
Additionally, my basic
EM Signal detection work was discussed in detail by one of
my research colleagues at a disaster mitigation conference
in Beijing, China back in 2003.
When I learned about
the existence of that technical paper I immediately
contacted the parties listed as references and offered to
assist them with that research effort. I have lists of
perhaps as many as 10,000 EM Signal detection times going
back to the start of 2001. Some go as far back as
1994. Many signal detection times before 2001 are also
stored in my archive records. And I have been doing
research on these EM Signals for decades and comparing notes
with other researchers for much of that time.
Mainland China
Government earthquake researchers never contacted me about
this subject matter back in 2003 when my data were discussed
in that Beijing disaster mitigation conference. Nor
did they contact me when I contacted them about that 2015
technical paper.
There are two points to
make here and a question to ask.
The first point is that
researchers in Mainland China apparently decided to spend a
considerable amount of time, money, and effort to
investigate this proposed earthquake forecasting
method. So at least one government decided that the
basic concept probably has some merit.
The second point is
that other than that one technical paper, I have not heard
about their having any success with that forecasting
method. And I believe that had they contacted me
either back in 2003 or in 2014 I might have been able to
provide them with enough support information that they could
have had this proposed forecasting method fully operational
by now.
3.2 - EM Signal Origin Locations Obtained
From Various Sources
When a high intensity
EM Signal is detected there are a number of ways such as the
following ones that can or might be used to determine where
the signal had its origins.
3.2.1 - Computer Programs
At the present
time, a probability based computer program that has been
formally copyrighted with the U.S. Copyright Office is being
used as the main source of information regarding where high
intensity EM Signals might have had their origins.
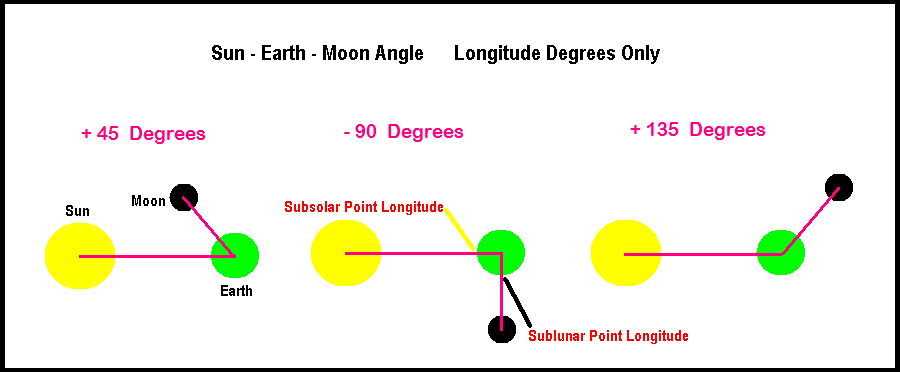
The sun and moon
gravity and ocean tide and Solid Earth Tide computations
that this computer program relies on are so highly unique
and unusual that it is unlikely that any other researcher
could even begin to duplicate the computer program without
my assistance.
An EM Signal time is
entered into that computer program. And the program
then determines the longitudes of the sun and the moon in
the sky at that time and also the averaged longitudes of
several ocean and Solid Earth Tide crests and troughs.
It can then then
compare those data with similar data for 5 and higher
magnitude earthquakes that have occurred around the world
since the start of 1973.
When the EM Signal data
are good matches for those same types of data associated
with some past earthquake it can be a sign that another
earthquake is getting ready to occur near where that past
one occurred.
That forecasting method
can at times produce excellent results. It can be
especially good for forecasting earthquake
aftershocks. We already know where and roughly when an
aftershock is likely to occur. And it can just be a
matter of determining that a high intensity EM Signals was
pointing to the approach of the aftershock.
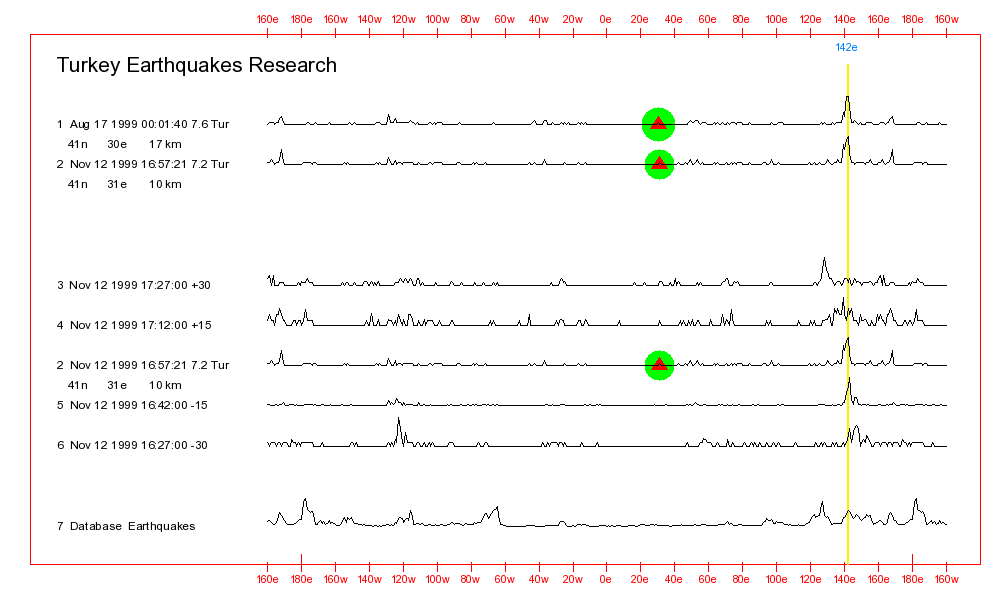
The following chart
shows how extraordinary the data can be that the present
version of the computer program generates.
The two destructive
Turkey earthquakes shown on Line #s 1 and 2 occurred a full
three months apart. And yet the line peak shapes for
the August 17 earthquake and its November 12 aftershock look
remarkably similar.
Line #s 3, 4, 5, and 6
show how different those line peak shapes would look for the
November 12 aftershock earthquake had it occurred just 15 or
30 minutes earlier, or 15 or 30 minutes later.
So, even the present
computer program that has never been optimized can generate
remarkable looking data.
Unfortunately, one of
the present version's major limitations is the the fact that
it deals largely with earthquake longitudes and not their
latitudes. And another limitation is the fact that as
just stated, it has never been optimized.
When the program was
created, fixed
weight factors were assigned to the
various sun and moon gravity-related forces that are being
used by the program. It was believed at that time that
they might be involved with both earthquake triggering
processes and with the generation of the types of EM Signals
that I myself work with.
Those weight factors
have never been checked to see if other values would produce
better results or to see if other types of forces should be
added to the list of ones that are presently being
processed. For example, forces that are likely
important to earthquake triggering processes that are not
yet being used with the computer program are associated with
solar and geomagnetic storms.
A self-optimizing
version of that computer program could be created without
too much trouble. And researchers around the world
could then use it to test different combinations of sun and
moon gravity-related forces etc. to see which ones produced
the best results.
It is expected that the
self-optimizing version of that program would demonstrate
that powerful earthquakes occurring in fault zones around
the world are often triggered by combinations of forces that
are specific to individual fault zones.
If the
triangulation location determination method could be with
these high intensity EM Signals then it might not only
produce excellent location results but also make this
forecasting method the most powerful, accurate, and reliable
one in existence.
Two or more detectors
would be used to tell in which direction an EM Signal was
strongest for each detector. And the location of the
EM Signal might be the point where lines drawn in parallel
with that direction for each detector crossed one another.
I myself do not have a
laboratory filled with the types of equipment that might be
used to do that type of triangulation work. And I am
not even certain regarding what types of detectors would be
best for that.
3.2.3 - Other Earthquake Precursors
Data on the following
Web page show that when a high intensity EM Signal is
detected, there can be precursors such as thermal anomalies
observed in the area of the fault zone that was responsible
for the EM Signal.
http://www.earthquake-research.com/archive/2015-03-29-PNG.html
At this time there are
unfortunately no established earthquake forecasting programs
for doing this. But, one could be easily developed
that would involve checking different fault zones for those
other types of precursors at the times when high intensity
EM Signals are detected. When those other precursors
were observed it could be a sign that an earthquake was
getting ready to occur in that area.
3.2.4 - Human "Remote
Viewers"
Human Remote Viewers
are discussed in the
Psychics and
Astrologers section of this Web page.
These people can at
times reportedly focus their minds on distant locations and
determine what is taking place at those locations.
Assuming that those
Remote
Viewing abilities are in fact real (and they probably
are), at the time when a high intensity EM Signal is
detected it might be possible to have specially trained
Remote
Viewers mentally scan fault zones around the world and
determine where the EM Signal had its origins.
3.3 - Earthquake Fault Zone Events That No
One Knows Are Taking Place
This section discusses
what I believe my EM Signal data are indicating are
significant earthquake fault zone events that are taking
place before many powerful earthquakes. And as far as
I am aware, no one else on the planet knows that these fault
zone events are occurring. I myself do not yet have a
good understanding of their nature.
The primary high
intensity EM Signals that I work with are most often
detected days or weeks apart from one another. But on
many occasions, several EM Signals have been detected a half
hour to several hours apart. I can't recall any
occasions when two of those high intensity EM Signals were
detected within a single half hour period of time.
When a single EM Signal
is detected it is easy to formulate theories for what might
be taking place. For example, something in a fault
zone where an earthquake is getting ready to occur causes a
geomagnetic pulse perhaps 20 seconds long to be generated.
It is more difficult to
proposed what would cause 2 of these signals to be generated
an hour and a half apart. And that has happened fairly
often.
It is even
more
difficult to propose what could cause a half dozen signals
to be generated, each one being detected almost exactly 45
minutes after the preceding signal. But as the data in
this section will show, that actually happened on January
25, 2001, shortly before a catastrophic earthquake occurred
in India. Those India precursor data also agree with
precursor data not discussed here that were reported by
other research personnel.
Researchers know from
examining Jet Stream and Total Electron Content data etc.
that distinct electromagnetic events appear to be occurring
in fault zones during the days, weeks, and months before
some powerful earthquakes occur. But they are
generally working with just a single precursor event.
They are so far apparently unaware that these multiple EM
Signal events are taking place.
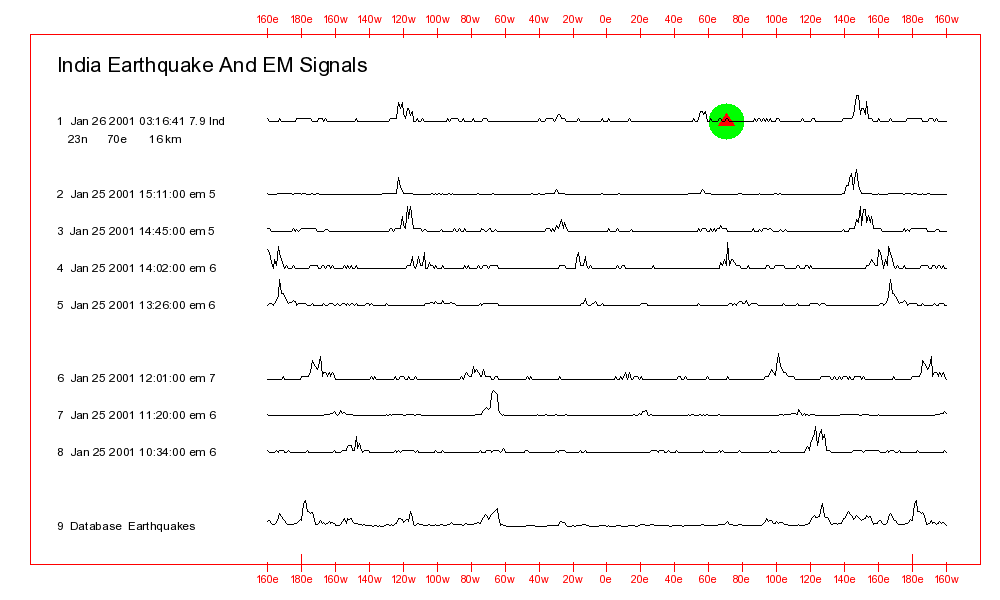
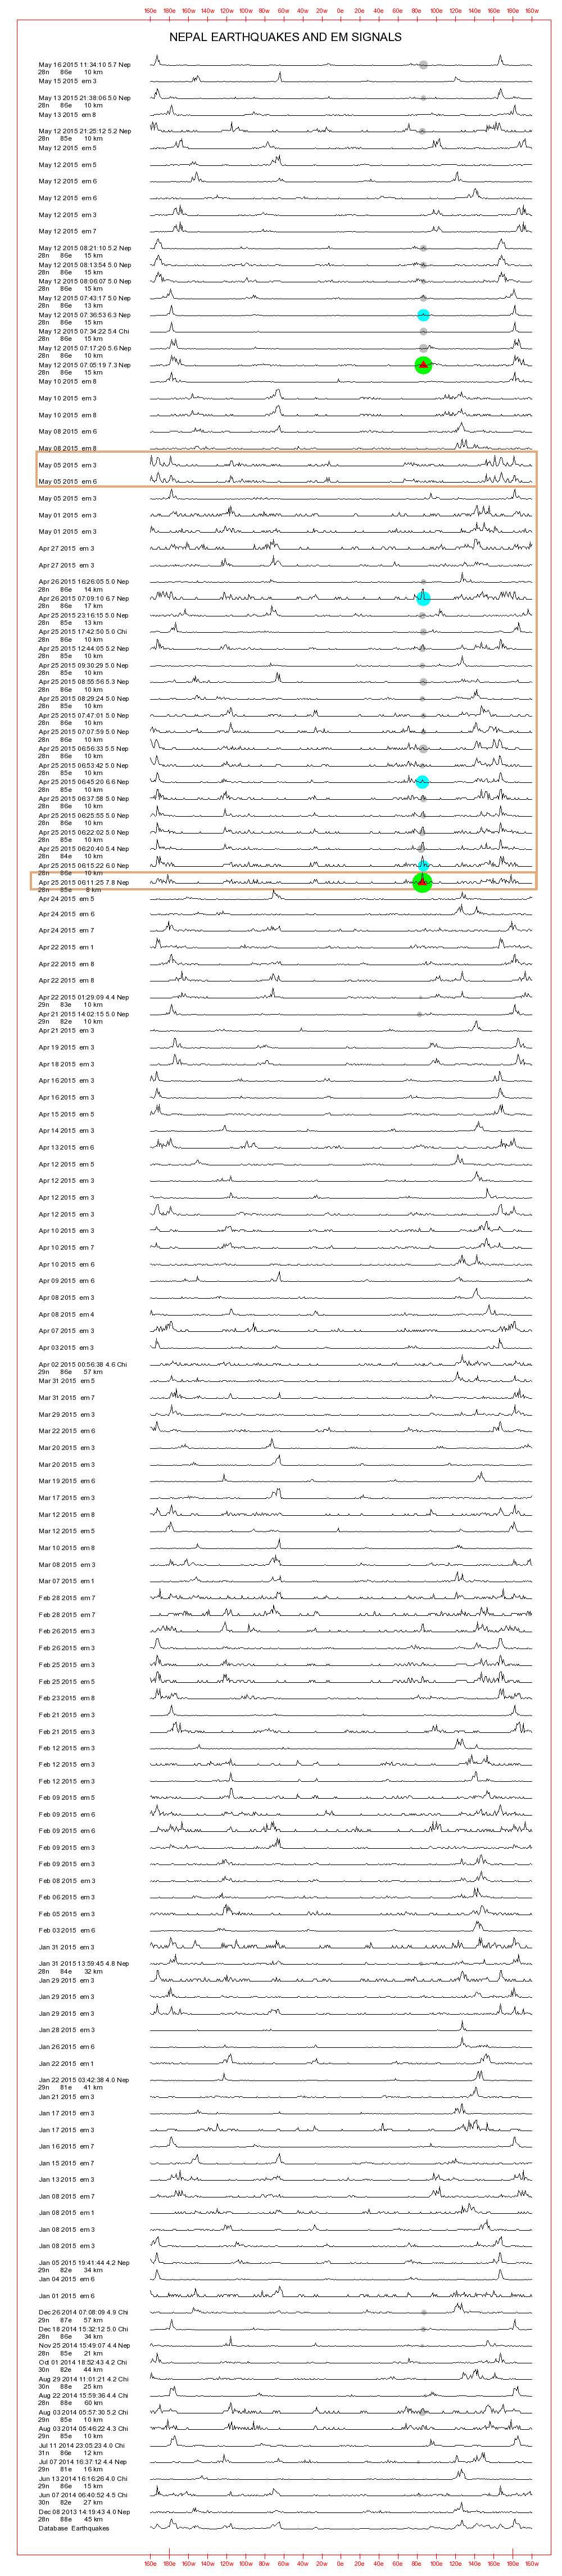
The Catastrophic January 26, 2001 India Earthquake
The chart below shows
some of my EM signal data collected during the 24 hours
before the following devastating earthquake. The chart
provides a good example of the existence of these multiple
EM Signal events.
2001/01/26 03:16:41 23.40N 70.32E 23 7.9
Southern India
There were quite a few
more data not shown on the chart that were collected during
the week before the earthquake.
EM Signals on Line #s
8, 7, and 6 were detected roughly 45 minutes apart from one
another. Then there was a 90 minute delay (45 x
2). Then the EM Signals on Line #s 5, 4, and 3 were
detected roughly 45 minutes apart from one another.
And then finally, the EM Signal on Line # 2 was detected
roughly 30 minutes after the Line # 3 EM Signal.
The EM Signals on Line
#s 3 and 2 are also good matches for the India earthquake
shown on Line # 1. That frequently happens when
multiple EM Signals are detected like that. The final
EM Signal in the group or the final 2 signals match the
powerful earthquake.
My present theories
pertaining to what forces were responsible for those EM
Signals detected before that India earthquake are quite
complex. The following is a brief summary of those
theories.
All of those EM Signals
were associated with electromagnetic events that were taking
place in the India fault zone before the earthquake
occurred. However, the almost exact 45 minute delay
between each EM Signal and the 90 minute delay between the
two groups of signals were I believe associated with a sun
and moon gravity force-related rocking back and forth of the
Juan de Fuca earthquake fault zone located off the coast of
Oregon. Pressure waves associated with an approaching
earthquake that occurred in that fault zone about a month
later traveled to the west following Solid Earth Tide
related forces. And when those pressure waves hit the
India fault zone they caused those seven EM Signals to be
generated.
After those EM Signals
were detected I telephoned my United Nations disaster
mitigation contacts and spoke with them on and off for about
5 hours in attempts to get them prepared for what I felt was
likely an approaching catastrophic earthquake.
After I finished
talking with them I sent E-mail earthquake warnings to
disaster mitigation groups around the world including quite
a few Red Cross and Red Crescent facilities.
Unfortunately, at that
time I had not yet developed the computer programs that I
presently use to determine where an expected earthquake
might be about to occur. So I could not provide anyone
with probable location information.
As expected, the
earthquake was devastating. Many lives were lost.
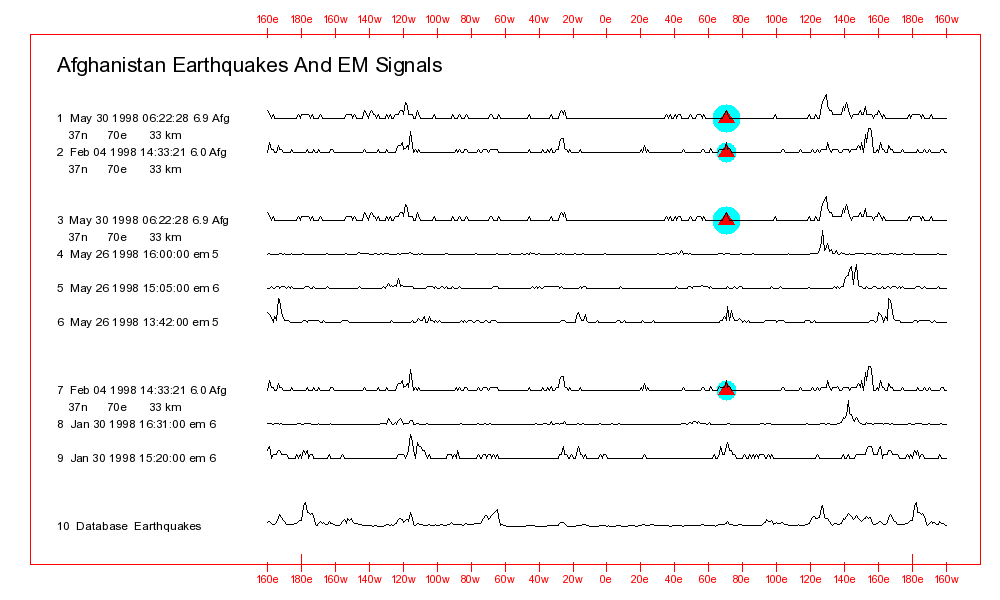
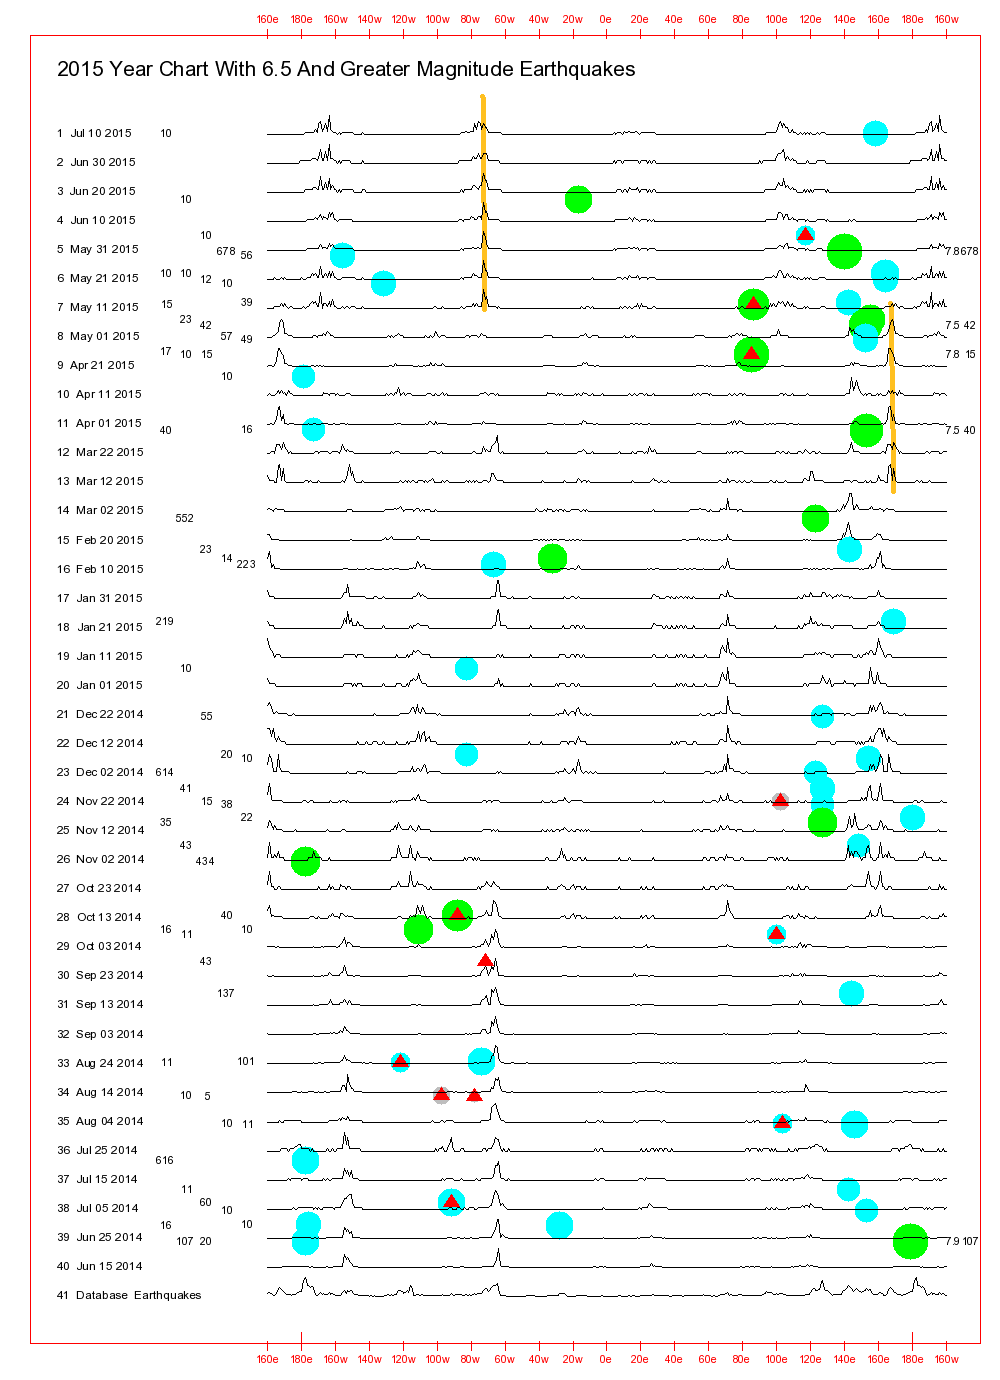
Two Devastating 1998 Afghanistan Earthquakes
The chart below
displays data for the following highly destructive
Afghanistan earthquakes and a number of high intensity EM
Signals that were detected roughly 4 days before each of
them occurred.
The fairly similar line
shapes for Line #s 1 and 2 indicate that the earthquakes
were probably triggered by somewhat similar sun and moon
gravity-related forces. However, those line shapes are
not as strikingly similar as the ones associated with the
two 1999 Turkey earthquakes discussed earlier on this Web
page.
The groups of high
intensity EM Signals detected before both of those
Afghanistan earthquakes once again indicate that significant
events are likely often taking place in earthquake fault
zones during the days, weeks, and months before powerful
earthquakes occur.
With those Afghanistan
earthquake EM Signals groups and with most other signal
groups like that I cannot presently propose with any degree
of confidence
why the signals are being
generated. However, I have found that in some cases,
when 2 high intensity EM Signals are detected within a few
hours of one another before an earthquake, each of the
signals will appear to eventually be linked with separate
powerful and identifiable approaching earthquakes.
Information regarding
those January 30, 1998 EM Signals was circulated before the
destructive February 4, 1998 Afghanistan earthquake
occurred. However, back then, my location
determination computer programs had not yet been
developed. And I could not propose where the expected
earthquake might be about to occur.
When the May 26, 1998
EM Signals were detected I concluded that another
significant earthquake might be about to occur. And
again, without my computer programs I could not tell where
it would occur. But I knew enough about the behavior
of the EM Signals at that time that on May 27, 1998 I
circulated an international public Earthquake Warning for an
earthquake that I stated I thought might occur in either
Iran and Afghanistan.
Copies of my warning
can be found in the sci.geo.earthquakes Internet Newsgroup
archives.
I actually had exact
location information for the expected earthquake. But
in my Newsgroup warning I thought it would be safer to not
include those details rather than risk having people living
in those areas panic. The warning instead stated that
people could contact me for that information.
The expected earthquake
occurred on May 30, 1998 exactly when and where I thought it
might occur. And it was reportedly especially
destructive because it occurred in an area where a civil war
was being waged. Rescue workers could not get into the
area to assist people without facing serious personal risk.
EM Signals That Are Detected At The Same Time As An
Earthquake Occurs
Large numbers of
high intensity EM Signals have been detected during the past
few decades. But during all of that time only two or
three high intensity EM Signals were detected at the same
time that a powerful earthquake occurred. That
suggests to me that the EM Signal generation processes must
be quite different from the processes associated with the
rock layer fracturing that happens when an earthquake
occurs.
EM Signals That Were Detected After
An Earthquake
On quite a few
occasions, a single high intensity EM Signal has been
detected during the 48 hours
following a powerful
earthquake. And the chart line shape for that EM
Signal is usually the same as the line shape for the
earthquake.
Present theories
propose that these EM Signals detected
after a
powerful earthquake are being generated when a pressure wave
heading towards the west that is associated with an
approaching earthquake hits the fault zone where the
powerful earthquake has just occurred. And the
pressure wave causes the EM Signal to be generated in a
manner that is somewhat similar to what happened during the
day before that previously discussed January 26, 2001 India
earthquake.
Comments
These high intensity EM
Signals are indicating to me that there are certain types of
important electromagnetic events and probably physical
and/or chemical process events that are often taking place
in fault zones around the world during the days, weeks, and
months before powerful earthquakes occur.
As stated earlier,
earthquake researchers are already aware from Jet Stream and
Total Electron Content data etc. that what appear to be
single electromagnetic events are occurring in the fault
zones. However, it appears to me from studying various
types of precursor data that for some unknown reason,
only
the high intensity EM Signals that I myself am working
with are showing that these multiple electromagnetic
events are taking place.
What significance these
multiple electromagnetic events might have for earthquake
forecasting science and for earthquake science in general
has yet to be determined.
A SUN SHADOW RELATED
EARTHQUAKE FORECASTING PROGRAM
The following URL is the
Internet address for what appears to be an inexpensive
earthquake forecasting program that, if it works, might be used
not only by governments around the world
but also
by people living in remote towns and villages who do not have
easy access to the Internet.
http://earthquake.itgo.com/today.htm
I myself don’t know all of
the details regarding how the program works. But the
general idea appears to me to be the following:
A small object is placed on
a window, for example, that is exposed to sunlight. On a
wall perhaps 5 or more feet from the window, the small object
casts a shadow. During the course of a day that shadow
would normally follow a specific path across the wall.
When the shadow deviates from that expected path it can be a
sign that an earthquake is approaching.
The person running that
program has apparently created routines for measuring the extent
and time of the sun shadow path deviations and then determining
where they are indicating that an earthquake will occur.
The following is the
address for a report that attempts to evaluate the forecasting
method:
http://earthquake.itgo.com/chen1.htm
Unfortunately, there
are no details at the Web site that explain exactly how the
program works. However, the person running the program has
stated that he will share those details for free with people who
have a sincere interest in duplicating and using the program.
The person who developed
the method post forecasts to the following Web site. Look
for ones stored there by "
Shan."
http://earthboppin.net/talkshop/rollem/
If other people could get
that forecasting method to work then it appears to me like it
should be so attractive and inexpensive for so many people and
governments around the world that it would undoubtedly be worth
the time and expense needed to get it running.
It should also be mentioned
that the person who created that program was reportedly given
an
official commendation by the Indonesia Government for his
research efforts related to his earthquake forecasting program.
HIGH FREQUENCY RADIO WAVES
ASSOCIATED WITH APPROACHING EARTHQUAKES
What appears to me to be a
relatively new and innovative earthquake forecasting program is
discussed in the December, 2016 issue of the NCGT journal.
The report's title is, "
High-frequency electromagnetic
emission in the earthquake epicentral areas detected by the
remote sensing frequency-resonance data processing."
Additional details can be
found on the following Web site:
http://www.geoprom.com.ua/index.php/ru/
The following is what I
believe the researchers who developed this method are saying.
The method was developed
for locating mineral and hydrocarbon deposits. However, it
can also be used to forecast some earthquakes.
It relies on radio wave
signals in the 20 megahertz to 1350 megahertz range. They
are associated with the vibrations and/or rotations of atoms,
molecules, and perhaps crystals. The radio waves are being
detected by orbiting satellites.
The theory seems to be that
during the months before some earthquakes occur, hydrogen,
helium, and hydrocarbon materials can enter the earthquake fault
zone. That might be the result of rock layer fracturing in
that area. Once there those substances can emit the high
frequency radio waves that are then detected by the satellites.
The people doing the
research are I believe stating that even though those substances
might be some distance beneath the surface of the Earth or even
out in the ocean, the radio waves can still be clearly detected.
Forecasting Earthquakes
By Monitoring Solar Storm Activity
A number of researchers
such as the following ones apparently believe that they can
predict earthquakes by watching for solar storms.
http://www.solarwatcher.net/
http://quakewatch.net/
My own theories propose
that a forecasting method based on the detection of solar and/or
geomagnetic storms can probably work to some extent. But
as with the EM Signals that I myself work with, I feel that
those solar storm-related predictions would actually largely
represent Time Windows during which there is an increased chance
of an earthquake occurring if one is getting ready to occur
anyway. If there are no fault zones anywhere that are
getting ready to fracture on their own then no amount of solar
storm energy is going to cause an earthquake to be triggered.
The
Solar And Geomagnetic Storms And
Earthquake Triggering section of this Web page contains
some additional theory information regarding this subject
matter. And, more information related to this subject
matter can be found by doing literature and Internet Web site
searches.
WEB SITE COMPUTER PROGRAM
RELATED FORECASTING METHODS
The subjects in this
section are planned for discussion in detail in a future version
of Web page. They are based on the Web site computer
program-related concepts that were described by me some two
decades ago on early version of the following Web page:
A
Demonstration Earthquake Forecasting Program
As the following picture
files from that
Demonstration
Earthquake Forecasting Program show, the basic concepts
involved with the method are fairly simple. And I feel
that they are essentially the basis for the
Multiple
Earthquake Precursors Data Evaluation Forecasting Method
discussed elsewhere on this Web page.
Different types of
earthquake precursor data collected from sources around the
world would be displayed on a map such as Map # 1 shown
below. Web page visitors could then click on some part of
the map such as the Los Angeles, California area and see
increasingly expanded maps of that area. That would then
enable them to see where earthquake precursors were being
detected.
It is amazing that even
today, several decades after that
Demonstration
Earthquake Forecasting Program Web page was made
available, governments and members of the international
scientific community have still not attempted to create an
earthquake forecasting program like that.
EARTHQUAKE
SENSITIVE HUMANS, ANIMALS, AND
PLANTS
Many reported observations of
human, animal, and plant types of Earthquake Sensitivity are not myths!
The discussions in this
section of this Web page are intended to provide Web page
visitors with some basic information regarding the highly
complex types of
Earthquake
Sensitivity that can be experienced by some humans,
animals, and plants.
The theories and data in
this lengthy section are based on personal observations,
published reports, and large amounts of unpublished data
provided to me by other earthquake researchers.
The subject matter in this
section of this Web page is so complex that the section is
divided into different parts, some more detailed than
others. To some extent, the same information might be
repeated in different parts.
A BRIEF SUMMARY
Anecdotal reports about humans and animals
being able to sense when an earthquake is approaching are often
observations of
real
and easily verifiable phenomena. For humans, conscious
sensations can include headaches and nausea.
Subconsciously people might experience unexplainable bouts of
anger, depression, or anxiety. Animals can become
disoriented. Plants can exhibit signs of stress in
response to energy fields etc. that are associated with
approaching earthquakes.
If they were used in
connection with earthquake forecasting programs that involved
the evaluation of a variety of earthquake precursors, human and
animal
Earthquake Sensitivity
types of data could be invaluable. Some data related to
plant sensitivity to approaching earthquakes might also be
useful.
For a variety of reasons,
used alone these types of data can have reliability
problems. And amateur and professional earthquake
researchers who are not aware of the nature of and the
limitations of
Earthquake
Sensitivity types of earthquake precursors are probably
not going to have much success with effectively using then or
with convincing other researchers that they can be
invaluable. That is unfortunate as they are some of the
most easily collected earthquake precursor data available.
Examples
Of Some Of The Reliability Problems
--- Different types of energy appear to be involved with
Earthquake Sensitivity.
Some of those types of energy are poorly understood.
Others are not understood at all.
--- Different people, animals, and plants respond in
different ways to the different energy signals.
--- Some approaching earthquakes generate clear
signals. Others generate few or no detectable signals.
--- Some earthquakes generate signals that follow easily
recognized patterns. Signals associated with other
approaching earthquakes don't seem to have any recognizable
pattern.
--- Some earthquakes might occur within days or hours
after a signal is detected. In other cases an approaching
earthquake might generate signals for more than a year before it
finally occurs.
SOME
THEORIES REGARDING HUMAN, ANIMAL,
AND PLANT RELATED EARTHQUAKE
SENSITIVITY
The following (underlined) are some of the approaching
earthquake-related phenomena that humans, animals, and plants
might be responding to. A few examples are listed after
each phenomenon.
--- Various types of signals that
are being generated by an approaching earthquake itself
***** Piezoelectric effect-related electromagnetic
energy field signals generated by the rock layers in a highly
stressed earthquake fault zone
***** Very low frequency sound waves (infrasound)
***** Ground vibrations associated with fault zone rock
layer fracturing
--- Signals associated with things
outside the fault zone that are being affected by the
approaching earthquake
***** Ground water levels could become elevated in some
area. Animals living in underground burrows in that area
might leave their burrows and head for higher ground in
response to water starting to fill the burrows.
--- Signals that are not directly associated with
the earthquake itself but rather with other phenomena such
as solar storms that will have an impact on some combination
of the occurrence time, the location of, and the magnitude
of an approaching earthquake
***** Consider a situation where a powerful solar storm
occurs and causes the Earth's geomagnetic energy field to
fluctuate. The solar storm energy then also causes an
earthquake to occur months before it would otherwise have
occurred. And observers incorrectly conclude that the
approaching earthquake was directly responsible for the observed
geomagnetic energy field fluctuations. In that case the
geomagnetic signals were actually useful earthquake
precursors. However, the approaching earthquake itself was
not what caused them to be generated.
Over the ages many
researchers have likely attempted to develop reliable earthquake
forecasting programs that are based on human, animal, and plant
sensitivities to those signals etc. Unfortunately, most of
those forecasting efforts have probably not been especially
successful. For example, in some cases animals might have
been able to detect the approach of a particular significant
earthquake. But in other cases they seemed to have been
totally unaware that one was approaching. And in yet other
cases the animals appear to be sensing that an earthquake is
approaching. But no earthquake occurs for months or years.
All of those observations
are explainable. And the data appear to be saying the
following:
---
Humans, animals,
and plants can sense the approach of some earthquakes.
---
Because there are
so many different variables or factors involved with
earthquake sensory phenomena, there are some earthquakes,
including even very powerful ones, that Earthquake Sensitive
humans, animals, and plants might miss completely.
---
In some cases an
approaching earthquake might generate signals that can be
detected for more than a year before it finally occurs.
And that lengthy signal generation time can confuse
observers. They are watching for an expected earthquake
for months without ever seeing one. And after a while
that might cause the observers to decide that observations of
unusual animal behavior, for example, are not reliable
earthquake precursors.
My own data and data from
other researchers suggest to me that changes in a variety of
local or global electric or magnetic fields that can take place
before many earthquakes occur are likely the most commonly
detected signals that Earthquake Sensitive humans, animals, and
plants can detect.
The following is a
collection of theories and observations related to those
electromagnetic earthquake precursors.
--- Phenomena such as the piezoelectric effect can cause
different types of electromagnetic energy field fluctuations to
be generated in fault zones in the days, weeks, months, and
years before earthquakes occur.
--- Individual electromagnetic signals can have
alternating current (AC) characteristics, or direct current (DC)
characteristics, or both.
--- The AC signals can have frequencies ranging from
perhaps .1 cycle per second up to hundreds of millions of cycles
per second.
--- Geomagnetic storm energy (which can have its origins
in solar storms) can probably interact with fault zones and in
the process contribute to or amplify certain fault zone activity
related electromagnetic energy field fluctuations.
--- Solar storm activity is associated with events taking
place in and around the sun. Interactions between solar
storms and the Earth's geomagnetic energy fields and earthquake
fault zones can be affected by the nature of the solar storm and
also the orientation of the sun's magnetic field lines relative
to those of the Earth.
--- About every 7 days the sun magnetic field lines
orientation can shift from being in the same direction as those
of the Earth to being in the opposite direction. Those
shifts can probably have an impact on the times when various
approaching earthquake-related electromagnetic energy field
signals are generated.
--- Earthquake fault zone activity related electromagnetic
energy fields can be focused in specific directions by a variety
of phenomena. As a result before an earthquake, a sensor
located a certain distance on one side of the fault zone might
be detecting strong energy field fluctuations while another one
an equal distance away on the fault zone's other side might not
detect anything. This is one of the important reasons that
some energy field detectors give the appearance of not producing
consistent results.
--- The geomagnetic storm - earthquake fault zone
interactions take place most often during the days and weeks
just before an earthquake occurs when the fault zone’s rock
layer's physical, chemical, and electrical properties change as
it gets close to fracturing. But they can also take place
months, and on occasion, probably more than a year before the
earthquake occurs.
--- Phenomena such as lighting strikes and I believe
geomagnetic storms can cause low frequency radio waves to be
generated. I expect that events taking place within fault
zones can also cause them to be generated.
--- Those low frequency radio waves can travel around the
world with relatively little loss in signal strength. Air
is a reasonably good conductor for them. Water is
better. And metal is best.
--- As the radio waves interact with fault zones and/or
when they are generated as the result of fault zone activities,
information regarding fault zone events can be superimposed on
them and then be carried by them around the world.
--- Some fault zone event-related electromagnetic energy
field fluctuations range in time from 0.25 seconds to perhaps 30
seconds in duration. Others may persist for hours, days,
and even weeks.
--- Because the times when those energy field fluctuations
occur can be controlled by forces or phenomena related to the
gravitational pulls of the sun and the moon and also forces or
phenomena related to geomagnetic storms etc., the fluctuations
can occur at high strain level times etc. in the same time
cycles which control earthquake occurrence times. Or they
can occur at somewhat random looking times which may be days,
weeks, or months apart.
--- Other earthquake precursors possibly related to
electromagnetic energy field fluctuations have been reported
over the years. They would include Earthquake Lights which
are a type of temporary, local luminescence, glowing balls of
light which may be suspended in the air, and static noise on
radio, television, and telephone transmissions.
--- Important phenomena such as the failure of electronic
devices including radios and telephones that are located near a
fault just before an earthquake occurs are discussed on the
NCGT
Journal Earthquake Precursor Data Web page.
--- Interactions taking place between earthquake fault
zones located even great distances apart can result in signals
being generated that are stronger than they might otherwise
be. For a hypothetical example, an approaching 8.0
magnitude earthquake in one fault zone might cause a signal
associated with a 4.0 magnitude earthquake which is about to
occur in another, distant fault zone to be amplified to a point
where it appears to be for a 6.0 magnitude earthquake.
--- Electromagnetic energy field fluctuations linked with
fault zone events and in some cases also with low frequency
radio waves that are affected by or generated as a result of
fault zone events, can produce strong reactions in humans,
animals, and some plants.
--- Various groups of animals such as cats, dogs, horses,
and catfish will have different types of and different levels of
sensitivity to those energy field fluctuations. And within
a single group of organisms such as dogs, different ones will
experience different types of and different levels of
sensitivity to those energy field fluctuations.
--- The responses of different organisms to the energy
field fluctuations can result from basic energy field -
biological system interactions. Those types of
interactions would be similar to having water heated by the
energy field of a microwave oven.
--- They can result as side effects of energy field -
biological system interactions that the evolutionary process has
deliberately built into the members of a specific group of
organisms for some reason such as to provide them with an
ability to detect light or to sense the orientation of the
Earth's magnetic field.
--- They might even result from energy field - biological
system interactions that result from a deliberate effort by the
evolutionary process to provide the members of a specific group
of organisms with an ability to detect the approach of an
earthquake.
EARTHQUAKE SENSITIVE PLANTS
Over the years I have
learned about many instances of humans and animals being able to
sense that a powerful earthquake was approaching. And when
preparing a Web page related to those abilities I decided that
if human and animal-related biological systems could detect
approaching earthquakes then it would be reasonable to assume
that some plants might also be able to do that. So, I
added that information to the original version of the following
Web page while it was being prepared:
Earthquake Triggering, Earthquake
Precursor Signal Generation, and Earthquake Sensitivity
Theory Pictures
In spite of my making that
logical decision regarding the plants it was still just a little
surprising to me when I learned a few years ago that several
earthquake researchers have actually done some research along
those lines. Work done by one of them is discussed on the
following Web page:
http://www.eqsigns.net/plants.html
After concluding that some
plants could actually detect electric signals associated with
approaching earthquakes, another researcher that I know about
decided to begin measuring the signals using electronic types of
sensors instead of having plants act as the original sensors.
From reviewing some of the
available information it appears to me that the plants are
largely responding to strong, static electricity types of energy
fields that approaching earthquakes can generate.
Inanimate object will often do the same thing.
The static electricity
energy fields might have have alternating or direct current
characteristics, or both.
There is also the
possibility that through the evolutionary process, some
varieties of plants that have been growing for thousands of
years near earthquake fault zones have built a sensitivity to
those energy fields into their genetic codes. So the
plants would essentially be "
programmed" to have specific
types of responses to the energy fields. For example, when
the energy fields were detected the plants might quickly attempt
to strengthen their stems and/or shed some of their foliage so
that they would be less easily damaged by strong
earthquake-related ground shaking.
EARTHQUAKE SENSITIVE ANIMALS
Over the centuries there
have probably been countless reports that discussed various air,
land, and aquatic animals having some type of observable
reaction when a powerful earthquake was approaching.
The book “
When The
Snakes Awake: Animals and Earthquake Prediction” by
Helmut Tributsch, 1978, 1982 and 1984, might have been one of
the earliest English language compilations of reports of unusual
animal behavior before an approaching earthquake.
A theory that I feel is
likely correct is that animals are usually responding to
electromagnetic energy field fluctuations that are linked with
events taking place in
local earthquake fault
zones. However, an occasional animal will be able to sense
those fluctuations when they are associated with fault zones
that are hundreds of miles away.
Some of the time,
Earthquake
Sensitive Animals might be responding to low frequency
sound waves associated with an approaching earthquake.
Some pet animals that might
behave as though they are earthquake sensitive could actually be
responding to fault zone activity-related behavioral changes
etc. that they are observing in their
Earthquake Sensitive
Human owners.
One earthquake researcher
reportedly checks or checked newspapers for notices of missing
pet animals. It is or was apparently his belief that some
pet animals can get disoriented by something such as an
electromagnetic energy field or sound wave that can be generated
before a local earthquake occurs. And the pet animals
might wander away from home.
Then by determining how
many pet animal were reported missing during a specific period
of time and comparing that number with the number of reports
from other periods of time he was able to conclude that larger
numbers of reports than usual could be an indication that an
earthquake was approaching for some area.
Another researcher checks
to see when large numbers of ants suddenly appear, and watches
news reports for events such as traffic accidents that indicate
that people in some area are becoming unusually angry or
distracted while they are driving. The theory is that
their anger etc. is being induced by the energy fields
associated with the approaching earthquake.
It is possible that
important information related to the signals that
Earthquake
Sensitive Animals including some humans are detecting
might now have become available because of the following
destructive earthquake:
2017/09/08 04:49:21 15.07N 93.71W 70 8.1 "87km SW of
Pijijiapan, Mexico"
The main high intensity EM
Signals that I myself work with last perhaps 20 seconds.
But
Earthquake Sensitive Animals can reportedly detect
signals that will last for hours or even days. As stated
earlier, pet animals, for example, can become disoriented and
wander away from home.
As the news report below
explains, that earthquake was reported as being unusual in that
it did not involve two tectonic plates slipping sideways past
one another, or a case of one tectonic plate pressing against
and being pushed beneath another.
Why
the 8.1 Magnitude Mexico Earthquake Was Unusual
As the report explains, the earthquake did actually involve two
tectonic plates that were pressing against one another.
However instead of being associated with one slipping underneath
the other it involved the
ocean tectonic plate cracking
or breaking some distance from the fault zone as a result of the
pressure.
Assuming that the report is
accurate, that suggests that the tremendous pressure needed to
cause the tectonic plate to fracture like that might have been
exerted over a period of several hours or several days.
And phenomena such as the piezoelectric effect could have
generated intense electric field activity over a large area.
There were in fact strong
electromagnetic signals lasting for hours that were generated on
August 14, 2017, about a month before the earthquake. And
I expect that many people were able to observe unusual animal
behavior around that time.
Several of the roughly 20
second EM Signals that I myself normally work with were detected
two days afterwards on August 16, 2017. And later that day
I circulated a formal Earthquake Warning to researchers around
the world. My analyses of those EM Signals and the
September 8, 2017 Mexico earthquake indicate to me that the
August 16, 2017 signals, primarily the second one, were
associated with that approaching earthquake.
Although there are
earthquake researchers, including myself, who strongly believe
that we could be using animals to tell when earthquakes are
approaching I am not personally aware of any formal earthquake
forecasting programs that are being presently run anywhere that
rely on observations of unusual animal behavior.
In a future version of this
Web page I am planning to discuss two additional subjects
related to the use of animals in earthquake forecasting
programs. The information related to the first subject
might be ten to twenty years more advanced than anything along
those lines that has been done to date. And the
information in the second subject might be a good fifty years
ahead of anything done to date. It is quite futuristic!
EARTHQUAKE SENSITIVE HUMANS,
PSYCHICS, ASTROLOGERS, AND REMOTE
VIEWERS
might actually be
some of the best sources of information regarding approaching
earthquakes. For one thing, they can be easily asked for
more information regarding their symptoms. You can't ask
an electromagnetic signal detector or an animal or plant for
additional data!
The following fairly
extensive discussion of human psychic abilities has been
included on this Web page for an important reason. That
reason is that
Earthquake Sensitive Humans, people who
are especially sensitive to certain types of electromagnetic
energy field signals, can at times be extremely good at telling
when a significant earthquake is approaching. And
scientists who are attempting to forecast earthquakes should be
taking advantage of the information that those people can
generate.
Unfortunately, scientists
and
Earthquake Sensitive Humans don't appear to me to
usually get along with one another especially well. And it
is hoped that the information in this section of this Web page
will help earthquake forecasting scientists better understand
how the
Earthquake Sensitive Humans' thought processes
work, and also let the scientists know about the invaluable
types of earthquake precursor information that the
Earthquake
Sensitives could be generating.
The information in this
section of this Web page is based on years of conversations with
various parties, observations, reviews of the literature, and
theories.
Human Earthquake Sensitivity might be thought
of as a type of "
Psychic"
ability. And in the past there have been various amounts
of fraud associated with the claims that people make regarding
their having psychic abilities. But it is my opinion that
most of the credibility problems that psychics have stem from
the fact that probably relatively few of them have any
scientific training. They are unable to distinguish
between real and illusional phenomena. And when they tell
other people that both the
real phenomena and the
illusional
phenomena that they might be observing or experiencing are
real, then people, especially scientists, eventually conclude
that none of the things that the psychics are telling them about
are credible.
Some psychic or paranormal
phenomena such as
Telepathy and
Clairvoyance
appear to quite real. Others such as
Teleportation
are in my opinion probably illusional. People might truly
believe that they are seeing something real. But it is
actually an interesting type of illusion.
My present theories propose
that ages ago, humans developed or inherited (evolution) psychic
abilities for two reasons:
1. These abilities helped parents to sense important
information regarding the health and safety of their young
children before the age of hospitals and wonder drugs.
2. These abilities are even today important to the
effective operation of the human immune system. For
example, they might be helping the immune system identify and
then destroy or neutralize certain types of cancer cells.
The best book that I myself have
come across for presenting a fairly good picture of what the
true
"psychic world" looks like is "
Wolf
Messing The True Story of Russia's Greatest Psychic"
written by his biographer Tatiana Lungin.
The original version was
published quite a few years ago. And I was happy to see
that either that first version or a newer version was published
once again in 2014. I myself have not yet had a chance to
examine the 2014 version.
Psychics Who Forecast Earthquakes
Psychics who can predict
earthquakes appear to me to rely on one or more of the several
different types of abilities. Some of those abilities are
briefly discussed in this section of this Web page.
Group 1 Psychics - Human Earthquake Sensitives
Depending on how a person
defines the word "
Psychic," the people in this first
group might be regarded as being "
Psychic." However, technically speaking,
they are actually "
Earthquake
Sensitive." They experience strong physical
and emotional responses to the electromagnetic energy field
fluctuations that can occur before some earthquakes. And
they sometimes conclude that the experiences they are having
indicate that they have psychic abilities because they can "
predict"
that a powerful earthquake is getting ready to occur.
As already stated, if the
word "
Psychic" is given
a broad enough meaning then
Human Earthquake Sensitivity
could be regarded as being one manifestation of human psychic
abilities.
The following is a
discussion of the biological, psychological, or emotional
responses that
Human
Earthquake Sensitives can have to the electromagnetic
energy fields or other types of signals such as low frequency
sound waves (infrasound) that can be associated with approaching
earthquakes.
All humans are
probably earthquake sensitive to some degree. Some
fraction of the population, perhaps one person in a thousand, is
sufficiently sensitive to be able to clearly tell when a local
earthquake is going to occur. A small fraction are
sufficiently sensitive to be able to detect signals associated
with earthquakes occurring around the world.
Earthquake sensitive
humans may experience physical, random or monthly type
hormonal, emotional, and brain activity related responses to
those energy field fluctuations. Headaches are among the
most common responses. Nausea and dizziness can occur.
Some people may experience abrupt, strong, and temporary or
even somewhat longer lasting mood swings. High or low
frequency tones may be heard in one ear or the other or in
both ears at the same time. Short duration muscle jolts
are common. Physical pain or some other type of
sensation in a hand or foot and in extreme cases actual
physical injury can occur. Dreams may be influenced by
those energy field fluctuations. Especially sensitive
people may begin hearing voices or seeing ghostly
images. I believe that some people might begin seeing
auras of different colors surrounding other people.
Some earthquake
sensitives can determine from which of their hands or feet are
being affected by those energy field fluctuations etc.,
roughly where on the planet an approaching earthquake is
likely to occur.
Because water is a good
conductor for the low frequency radio waves, earthquake
sensitive humans will sometimes experience stronger reactions
to the fault zone activity related energy field fluctuations
when they stand near a large body of water such as on the
ocean shore. Their reactions may get abruptly stronger
when they stand near metal water pipes in a house and even
when they begin running tap water into the kitchen sink.
People who have water
dowsing abilities are probably often detecting those energy
field fluctuations as the signals travel through underground
sources of water. I understand that dowsers are not
usually able to detect the presence of electrically isolated
bodies of water such as water present in a plastic swimming
pool.
Diet modification and
dietary supplements can at times be used to control painful
headaches or other undesired responses to those fault zone
activity related electromagnetic energy field
fluctuations. Common pain control medications such as
aspirin may help. People who are strongly earthquake
sensitive may need to rely on prescription drugs.
Certain types of medications such as aspirin and foods can
temporarily increase a person's sensitivity to the energy
field fluctuations.
Biofeedback can
reportedly help reduce earthquake sensitivity. And I
would expect that hypnosis might also work for some people.
Some earthquake
sensitives have reportedly been able to reduce the number and
severity of their headaches or mood shifts etc. by moving to
some other part of the country where fault zone activity
related electromagnetic energy field fluctuations are weaker
or at least different. After such a move it might
require several weeks for the undesired energy field related
responses to be reduced in strength.
An inexpensive and
effective way to detect approaching earthquakes might
involve having a number of people who are earthquake sensitive
contact some central facility when they were having earthquake
warning experiences such as headaches. If 100 in some
area were reporting in and only few in surrounding areas were
doing the same then that might be a sign that an earthquake
was about to occur near that first area. Additionally,
earthquake forecasters and researchers could always ask the
earthquake sensitive humans for more information when
desired. That is not easily done with earthquake
sensitive animals, conventional radio signal receivers, or
seismic activity monitors.
Problems Associated With Human Earthquake
Sensitivity
As noted above, people who are strongly
Earthquake Sensitive can reportedly experience various types of
physical and emotional problems when a powerful earthquake is
approaching. That phenomenon has been reported by a number
of researchers.
It is my understanding that
one earthquake researcher (
charking@viser.net)
believes that earthquakes that are
about to occur in certain countries including Bolivia and
Argentina, and especially Chile, are particularly good at
generating EM Signals that can cause problems for
Earthquake Sensitive Humans.
It has been proposed that
those EM Signals can cause large segments of the population to
become irritated, probably for most people at the subconscious
level. And that can result in people becoming unusually
angry, self-destructive, and even violent.
If that is the case then
this is something that certainly should be investigated.
And years ago I personally wrote to the U.S. Surgeon General and
recommended that some medical studies be run to see how
widespread and serious this phenomenon might be. We
certainly would not want to have someone piloting a passenger
aircraft if and when he or she had become unconsciously
irritated by a powerful approaching Chile earthquake!
Gamma Ray Bursts
Many
Earthquake Sensitive Humans
also reportedly experience strong physical and emotional effects
when there are strong solar and/or geomagnetic storms. And
one earthquake researcher (
charking@viser.net)
has reported that some of those effects
can be associated with GRB events.
A GRB (Gamma Ray Burst) is
an intense burst of high energy gamma rays (relativistic
photons) that are believed to usually have their origins in
distant galaxies. Astronomers have proposed that GRBs can
be generated when a massive star collapses and becomes a
black
hole. The gamma ray beams are so highly focused that
they can travel for billions of years through interstellar space
and still have a strong impact on orbiting satellites, and on
the Earth when the GRB photons hit the atmosphere.
Assuming that those GRB
effects are real and at times significant, then it would be
logical to assume that there might be similar effects associated
with the Gamma Ray Bursts that are reportedly generated when
thunderstorms cause powerful lightning bolts to occur.
Transcranial Magnetic Stimulation
Human Earthquake
Sensitivity appears to me to probably be related to the
medical treatment Transcranial Magnetic Stimulation (TMS).
https://en.wikipedia.org/wiki/Transcranial_magnetic_stimulation
It is probably not a
coincidence that TMS is being used to treat headaches and
depression, medical problems that are common for people who are
strongly
Earthquake Sensitive.
"
Psychic" types of
earthquake forecasts that are based on
Human Earthquake
Sensitivity can be quite accurate. And in theory
they could provide us with invaluable forecasting data.
However it has been my observation that many of the people who
have this particular type of ability unfortunately do not have
the analytical, scientific, or organizational skills needed to
generate the types of reliable and effective forecasts that
government officials and disaster mitigation personnel need if
they are going to prepare for an approaching earthquake.
Having Human And Animal
Earthquake Sensitives Detect Fault
Zone Locations
Quite a few years ago I
concluded that it might be possible to forecast some earthquakes
or gain information regarding earthquake fault zones by having
Earthquake Sensitive Humans
and/or Animals travel back and forth across earthquake fault
zones in specially designed aircraft.
When those people got near
a fault zone they might experience symptoms that would be quite
strong if an earthquake were getting ready to occur there.
Animal behavior could also be monitored. If
Earthquake Sensitive Animals
became agitated as the aircraft traveled across the fault zone
then that could be a sign that the fault zone was active.
Since that time I have
learned quite a bit more regarding when and how earthquake fault
zones generate the types of electromagnetic signals that humans
and animals can sense. And based on what I have learned I
still feel that this approach to forecasting earthquakes could
work, just not as well as I originally thought. This is
because the fault zones appear to generate the EM Signals at
only certain times. And the
Earthquake Sensitive Humans and Animals might
be traveling over the fault zone at the wrong time and miss an
approaching earthquake.
In spite of that, this
would be such a simple and inexpensive way to forecast
earthquakes that it should probably be attempted.
To my considerable surprise
I was happy to learn a number of years ago that someone has
already attempted something along those lines.
Someone who has the ability
to sense that an earthquake is approaching sat in a car that was
being driven back and forth over a certain part of the
countryside. And she was able to tell from the physical
sensations that she was experiencing that there was a fault zone
at a specific location. And that person's conclusion
regarding the existence and location of the fault zone was later
supported by more conventional scientific data.
The May 25, 2016 entry on
the following Web page (blog) contains a detailed account of
that series of events:
https://thecharlottekingeffect.com/
Group 2 Psychics - Precognition
The people in this
second group are at times seemingly able to actually predict
future events when there is nothing that anyone could imagine
would be a present or past event or experience that could be
used as a basis for making such a prediction.
This
precognition
type of phenomenon has been studied extensively under laboratory
conditions over the years. And it appears that it can be
quite real.
Earthquake predictions
based solely on
precognition would appear to defy all of
the known and widely accepted laws of classical physics as far
as I am personally aware. Those laws state that in the
universe as we understand it, only the "
present"
exists. The
past exists only in our history
books. And the
future exists only in science
fiction books.
According to classical
physics, no one should be able to
see into the future
and determine what is going to happen.
In my readings over the
years regarding earthquake related phenomena and events, I
cannot recall hearing about any
precognition-related
earthquake predictions being made. However, since true
"psychics" have been able to accurately predict so many other
types of events there have undoubtedly been some of these types
of earthquake predictions made over the years. And I have
simply not done enough reading to come across any of them.
Astrologers Who Predict
Significant Earthquakes
It is my understanding that
the science or art of "
Astrology" is practiced by people
who often try to predict future events by generating elaborate
tables, charts, and drawings that rely on a variety of phenomena
such as birth dates, the phase of the moon, and the locations of
planets in the sky.
And once again, this type
of prediction also appears to defy all of the known and widely
accepted laws of classical physics as far as I am personally
aware.
--- I personally strongly suspect that accurate
predictions of approaching earthquakes and other future events
probably
cannot be generated if they are based
only
on those types of astrology charts and tables etc.
--- However, I also expect that for the unusual reason
discussed below, astrologers
are at time probably able
to accurately predict some future events including approaching
significant earthquakes using their charts and tables etc.
Question - How is that possible?
Proposed Answer - Some astrologers who can
accurately predict future events are in reality members of
that Group 2 or perhaps the Group 1 Psychics discussed earlier
on this Web page. And they are actually using their psychic
abilities to make their predictions. The tables,
charts, and drawings are simply the tools
that they use in order to do that.
That
proposed answer
should not sound unusual to anyone who has studied paranormal
phenomena. Over the centuries psychics have often used
tools
like that to help them predict future events. Other such
tools
would include collections of bones, tea leafs, and the
observation of celestial events.
And so, if there were
two astrologers who had identical training with one having true
psychic abilities and the other having none, then the one who
actually
had those
abilities would be able to make at least some accurate
predictions of future events including some earthquakes.
The other person's predictions would simply be lists of random
events.
As stated elsewhere on this Web page,
Earthquake forecasting data need to speak for themselves!
Earthquake forecasters
should not automatically dismiss earthquake predictions that are
based on psychic or astrological information just because the
predictions would seem to have no rational basis in our
understanding of how our universe works. In some cases
those predictions might actually be quite accurate and valuable.
Group 3 Psychics - Remote Viewers
The psychics in this
group are often called "
Remote Viewers." In
parapsychology terms they would probably be referred to as being
"Clairvoyant."
Based on my reading I would
expect that properly trained people who have
Remote Viewers
abilities might at times be able to focus their minds on some
section of the world and tell that an earthquake was getting
ready to occur at that location.
Remote Viewing And Psychic Spies
For years, the U.S.
Government reportedly attempted to have
Remote Viewers
work as
psychic spies in its Stargate Project.
https://en.wikipedia.org/wiki/Stargate_Project
It is my understanding that
there was a lot of public embarrassment among U.S. Government
officials when it was discovered that some
psychic spy
program personnel had gotten sidetracked from their original
goals.
During the Cold War the
Soviets were reportedly running a similar
psychic spies
program.
It is also my understanding
that the U.S. Government presently denies that its
psychic
spies were ever able to accomplish anything. But I
believe that in reality they were probably actually able to do
at least some effective spying work.
Until recently I
thought that it was most likely that U.S. Government claims that
it psychic spies never accomplished anything was part of a
deliberate disinformation campaign. However, after reading
the Wikipedia article listed above regarding
Remote Viewing
and psychic spies I am now of the opinion that the real problem
with the program likely had to do with what appears to me a
general lack of understanding regarding the actual nature of
Remote Viewing
phenomena. And without that type of understanding, program
personnel could not set or achieve realistic goals.
For example, there were
program personnel who believed that it might be possible for
some psychics to "
Walk through walls." Observations
of people walking through walls are in my opinion types of
psychic
illusions. A photograph of what was taking place
would show that the psychics were not truly walking through any
walls regardless of what observers thought they were seeing.
It doesn't sound to me like
any governments are presently attempting to work with
Remote
Viewers.
The earthquake forecasting
abilities of these Group 3 psychics are discussed further in the
EM Signals section of
this Web page.
Why Some Scientists And Medical Workers
Don't Like Psychics
There appear to me to be at
least two reasons for that. And the second reason is
probably the much stronger one.
Reason # 1
The
scientific mind
and the
psychic mind appear to me to be quite different
from one another. The two groups probably rely on the use
of dramatically different sections of the human brain.
Scientists usually want the
information that they deal with to be nicely organized and
understandable. And even phenomena that they regard as
being
chaotic are still considered to have a certain
amount of symmetry or order associated with them.
Probably most psychics, in
contrast, don't spend a lot of time looking for any type of
scientific order or logic in the information that they deal
with.
One of the consequences of
this is that when scientists attempt to work with people who
have psychic types of abilities, they can find it difficult to
keep the psychics focused on a specific task. The psychics
might tend to let their minds wander. And they begin
talking about the spirit world and creatures from outer space.
Eventually the scientists
grow impatient with the psychics and stop talking with
them. Or, the scientists become concerned about what their
colleagues will think about their talking with people who
believe in ghosts. Or, the psychics become irritated at
the scientists' lack of interest in some of the things that the
psychics feel are important. And they stop cooperating
with the scientists.
As a scientist and
earthquake forecaster and researcher I myself talk fairly often
with people who are strongly
Earthquake Sensitive.
And if they wish to discuss their interest in the spirit world
or in creatures from outer space then that doesn't bother me as
long as they are willing to focus most of their attention on the
subject of forecasting earthquakes. Additionally, comments
that they offer regarding the spirit world etc. can provide
valuable insight into how they are able to sense that an
earthquake is approaching.
Reason # 2
This is probably by far the
main reason that some scientists and medical worker don't like
people who have psychic abilities.
Most human beings appear to
me to have something built into their minds that encourages them
to want to put greater faith in explanations for how our world
works that involve supernatural or paranormal phenomena rather
than explanations that involve classical biology, chemistry, and
physics. And given the choice, many or most people would
probably prefer to listen to advice given to them by psychics
rather than advice from scientists and medical workers.
On the positive side, that
tendency to rely on supernatural explanations for how our
universe works might have help keep the human race from
destroying itself during the Cold War when nuclear weapons
became so numerous and widespread.
Psychic types of
information can at times, in my opinion, be helpful. And
they are generally at least entertaining. But, on the
negative side, the tendency that many people have to prefer to
listen to advice from psychics can at times be harmful.
For example, someone who has an appendix that is about to burst
would not want to exclusively seek medical treatment from a
psychic
healer. The resultant delay in getting
critically important conventional medical treatment could cost
that person his or her life. He or she should instead be
calling an ambulance and heading for the nearest hospital
emergency room!
When people tell
scientists and medical workers that they would prefer to listen
to psychics rather than to them even in cases where it appears
obvious that fraud is involved, it can infuriate the scientists
and medical workers. And that can then result in their
condemning any and all people who claim to have psychic
abilities.
Instead of regarding all
psychic and paranormal phenomena as being imagined or
fraudulent, scientists and medical workers should develop an
understanding of the actual nature of those phenomena and a
tolerance for the opinions of people who believe that they are
real. The various groups might then be able to more
peacefully coexist and even make some progress with solving
world problems.
On the other hand, it has
been my personal experience that quite often, when scientists
and medical workers get to the point where they are willing to
accept the fact that some paranormal phenomena are real, they
tend to toss out our universe's rule book. And they start
believing that all reports of paranormal phenomena are
real. They fail to realize that some realistic looking
paranormal phenomena such as
mental energy-related spoon
bending,
teleportation, and some reports of
encounters with
flying saucers are probably more likely
often the product of
psychic types of illusions.
It will be interesting to
see if this section of this Web page will be helpful with
getting scientists and medical workers to better understand the
true nature of certain important paranormal phenomena such as
Human
Earthquake Sensitivity, and more tolerant of discussions
of them.
A HAITI RESIDENT'S ASTONISHING
FIRSTHAND ACCOUNT OF HOW
HE SURVIVED HIS COUNTRY'S
DEVASTATING 2010 EARTHQUAKE
This section of this Web
page has been included here because it provides a stunning
example of the previously discussed phenomenon that is often
referred to as "
Human Earthquake Sensitivity."
There are additional
details regarding the events being discussed here. But I
decided not to add them to this section of this Web page because
I felt that the information might be too upsetting to some Web
page visitors.
The following is from a
firsthand account by a Haiti resident who survived the following
extremely deadly 2010 Haiti earthquake.
2010/01/12 21:53:10 18.45N 72.44W 10 7.0 HAITI
REGION
That devastating earthquake
reportedly claimed a quarter of a million lives. And it
wrecked havoc on the economy of Haiti and on the Haiti general
public.
The people and the country
of Haiti have still not yet fully recovered.
The following are a few of
the Internet Web sites where the tragedy is discussed.
https://en.wikipedia.org/wiki/H/C3/B4tel_Montana
https://sites.google.com/site/hotelmontanahaitiearthquake/survivor-s-stories
Perhaps 1 person in 1000 is
strongly
Earthquake
Sensitive. Present theories propose that when
an earthquake is getting ready to occur, electromagnetic energy
field fluctuations associated with the approaching earthquake
can be generated that will interact with a person’s body and
mind energy fields causing him or her to experience a wide
variety of physical and emotional symptoms.
This phenomenon appears to
me to likely be related to the
Transcranial
Magnetic Stimulation (TMS) medical procedure where strong
magnets are used to treat headaches and depression.
On the morning that the
Haiti earthquake occurred, the Earthquake Sensitive Haiti
resident (a male) who survived the earthquake experienced, and I
quote, "
A lost of balance, heavy nausea, anxiety, and an
extremely painful migraine headache. Everything seemed
to be distorted."
In spite of his severe
symptoms he went to a work-related meeting that was being held
at the Montana Hotel in Haiti. However, later that day his
symptoms became so unbearable he decided to return home.
Based on his past experiences with those symptoms he concluded
that a powerful earthquake might be about to occur. And on
his way home he visited four supermarkets, filling one shopping
cart after another with emergency supplies.
At 21:53:10 UTC time the Haiti
earthquake occurred. Before the shaking stopped the
Montana Hotel was heavily damaged. And one of the
Earthquake Sensitive person's coworkers who was still at the
hotel at that time lost his life when the section of the hotel
he was in collapsed.
Most of the people who are
strongly Earthquake Sensitive and who know that this type of
sensitivity to approaching earthquake-related energy field
fluctuations is responsible for their physical and emotional
symptoms likely regard this “
allergy to approaching
earthquakes” to be an unpleasant and undesirable “
curse”
of sorts. Several strongly Earthquake Sensitive
individuals that I myself have spoken with have even had to be
repeatedly hospitalized because their symptoms became so severe.
This account regarding the
Haiti earthquake survivor might represent the first reported
case in history where a human life might actually have been
saved
by this unusual “
allergy.”
The Haiti resident who
survived the earthquake has not been identified here by
name. But I do have an E-mail address for him. And
it is possible that with a little effort he could be coaxed into
doing a television or radio interview where he would be willing
to publicly discuss his harrowing, life threatening experience
with that devastating 2010 earthquake.
THE ELUSIVE AND
DECEPTIVE NATURE OF EARTHQUAKE
PRECURSORS
As this section of
this Web page will demonstrate, some earthquake predictions
probably fail because the earthquake precursors that they
are based on have complex, elusive, and deceptive
natures.
This is an expansion of the
Brief Introduction To The Science
Of Earthquake Forecasting
section of this Web page. Web page visitors who have not
already read that Web page section
should probably do so to have a complete understanding of this
subject matter.
As stated somewhat
differently in another section of this Web page:
The history of the
human race is littered with the remains of earthquake
predictions that failed.
Earthquake predictions
probably fail fairly easily when forecasters base their
predictions on just one type of earthquake precursor, and at
times even when several different types of earthquake precursors
are evaluated.
Over the centuries many
earthquake forecasters have predicted that an earthquake would
occur at some time and place only to have their prediction fail
because the earthquake precursor data that they were working
with were not as reliable as they thought.
Also quite often in the
past, powerful earthquakes occurred without first generating any
of the precursor signals that forecasters believed should have
been detected.
Earthquake fault zone
strain measurement data might be fairly reliable. But it
has been my personal experience and also my observation from
evaluating other researchers’ precursor data that many and
perhaps even most earthquake precursor data can be frustratingly
elusive and deceptive. And those
Elusive And Deceptive
Earthquake Precursors Data problems are perhaps the most
important reasons for using the
Multiple
Earthquake Precursors Data Evaluation Forecasting Method.
Since that forecasting method involves the use of more than one
type of earthquake precursor data it should have a certain
amount immunity from at least some of those
elusive and
deceptive data problems.
My own data indicate to
me that a good part of those Elusive And Deceptive
Earthquake Precursors Data problems could be due in
part to the occurrence of certain complex electromagnetic
events that are associated with earthquake fault zone
activities.
Those complex events would
include ones associated with the generation of the EM Signal
type earthquake precursors that I myself work with. Those
signals appear to be linked with fault zone activities and also
quite often with solar and/or geomagnetic storms. And that
means that
the occurrence and observation of any number of
different types of earthquake precursors might be dependent on
both the buildup of strain in the
fault zone, and, to some extent,
solar and geomagnetic storm activity.
Most earthquake researchers
are apparently not aware of the existence of the electromagnetic
events that I myself work with (See:
Data.html,
Data-2.html,
and
Data-3.html).
There are a number of different types of signals involved.
But the main EM Signals that I use with my forecasts might often
have
durations of only about
20 seconds. And without other researchers even being aware
of the existence of those electromagnetic phenomena they likely
cannot see that many and perhaps most earthquake precursors
occur around the same time as, and might even be influenced by
those electromagnetic phenomena.
The following
earthquake that has already been discussed at length on this Web
page is an especially good example of one that appears to have
generated highly deceptive earthquake precursor signals:
2015/09/16 22:54:33 31.57S 71.65W 25 8.3 46km W of
Illapel, Chile
Back in the Fall of
2014 a number of earthquake researchers including me felt that
there were strong warning signs that a powerful earthquake could
be about to occur in the Chile, South America area. See
https://groups.yahoo.com/neo/groups/earthwaves/conversations/topics/17881
for one example.
And that Chile earthquake
did eventually occur, but not until a year later, on September
16, 2015.
Some forecast data related
to that earthquake that were collected and generated by other
researchers were discussed in the September, 2015 issue of the
NCGT Journal. See the
Multiple
Earthquake Precursors Data Evaluation Forecasting Method
section of this Web page for details.
My own EM Signal type
precursor data related to that earthquake can be seen through an
examination of the “
Year Charts for the years 2001 through
2015” chart displayed on the
Data.html
Web page.
The chart below taken from
that
Year Charts file shows strong line peaks around 70 W
beginning in late April of 2014 and continuing on until the
middle of October, 2014 when they disappeared. They
reappeared in late May of 2015 and continued on until the middle
of August, 2015. At that time they shifted to around 120 E.
As stated in the
Multiple
Earthquake Precursors Data Evaluation Forecasting Method
section of this Web page, I believe that those data
generally agree with precursor data that other people were
circulating back in 2014 and 2015.
The reasons that the
line peaks like the ones at 70 W appear and then disappear for a
while and then appear again are complex. Theories for that
are discussed in detail in the
Line
Peak Appearance And Disappearance section of this Web
page. One of the reasons is that my computer programs
amplify the strongest signals detected during a Time Window so
that they are full scale on the chart. So if an
approaching earthquake is generating signals that have an
intensity of 10 and another earthquake starts generating signals
that have an intensity of 100, the 10 intensity ones will
temporarily disappear from the chart.
Most earthquake researchers
probably believe that precursors are being generated and
detected for the most part, only during the weeks and months
before an earthquake occurs. But in the case of that Chile
earthquake, strong precursor signals were apparently being
generated on and off for about a year and a half before it
finally occurred. And it appeared to me that they had
everyone confused including me. The line peaks kept
appearing around 70 W. And there was never any earthquake
to explain them. I thought that something might have gone
wrong with my forecasting program.
My data also indicate to me
that EM precursor signals were being generated for about nine
months before the extremely powerful 2011 Japan earthquake.
2011/03/11 05:46:24 38.30N 142.34E 32 9.0 Near The East
Coast of Honshu, Japan
Those Japan earthquake
related signals were quite different than the ones that I
normally use for my earthquake forecasts. And at that time
it was not possible for me to determine that the Japan
earthquake was approaching.
Those same types of signals
were also generated for perhaps a month or more before the
following two recent destructive Japan area earthquakes.
2016/04/15 16:25:06 32.78N 130.73E 10 7.0 1km WSW of
Kumamoto-shi, Japan
2016/04/14 12:26:36 32.85N 130.63E 10 6.2 7km SW of Ueki,
Japan
The signals continued to be
detected after the first of those earthquakes occurred.
And they abruptly stopped after the second one.
Three points can be made at
this time:
1. Quite often, various expected earthquake precursors
are apparently not being generated at all before some
earthquakes occur.
2. In other cases the precursors might be generated on
and off for more than a year before the earthquake occurrence
time.
3. Which earthquake precursors will be generated before
which earthquakes and for how long they will be generated
beforehand appears to me to be highly dependent on a variety
of factors including probably, the fault zone location and its
environment, and the occurrence of solar and geomagnetic
storms.
In summary, many earthquake
precursors appear to frequently be deceptive and
unreliable. And it can be difficult to generate high
accuracy forecasts when the precursors being evaluated are so
deceptive. That is one of the main reasons for using the
Multiple
Earthquake Precursors Data Evaluation Forecasting Method
when earthquake forecasts are being prepared.
WHY GOVERNMENTS CAN'T PREDICT
EARTHQUAKES
:
If, as this Web page explains, "
Earthquakes
CAN be predicted," then why aren't governments
predicting them?
The reasons that
governments and nongovernmental organizations cannot presently
forecast earthquakes might presently be the most important
subject related to earthquake forecasting. This section of
this Web page has been included here because before a problem
like that can be
fixed, people first need to recognize
the fact that the problem does in fact
exist and also
understand
why it exists.
The
Special
Interest Groups Web page contains a detailed
discussion of some of the reasons that governments and
nongovernmental organizations (NGOs)
are not
doing numerous things that they should be doing such as
forecasting earthquakes, and other things that people would like
them to be doing. However, the science of
Earthquake
Forecasting has a few special problems of its own.
Several are discussed in this section of this Web page.
For many centuries
earthquake forecasters had to work with earthquake precursor
data and other types of data that were of questionable
value. But in the past few years earthquake researchers
around the world have demonstrated that quite a few high quality
earthquake precursor data are now available. And so that
"lack of reliable data" problem is no longer the primary one
holding back the science of earthquake forecasting. Three
other problems are now at the forefront of this science.
And there are probably some others not listed here.
Problem # 1 - The Elusive And Deceptive
Nature Of Earthquake Precursors
One of the major problems
with earthquake forecasting is the fact that, as the
Elusive And Deceptive Nature
Of Earthquake Precursors section of this Web pages
explains, even though there are quite a few different types of
high quality earthquake precursor data available, many of them
can still be misleading. And since many earthquake
forecasts are based on various earthquake precursors, if the
precursor data themselves cannot be trusted, any earthquake
forecasts based on them cannot be trusted.
The primary goal with
forecasting earthquakes is to let people and government agencies
know that a significant earthquake could be approaching so that
they can take necessary protective measures such as:
--- Getting out of and staying out of structurally
unsound building
--- Shutting down electric power and fuel lines so
that unstoppable fires
don't get started
when an earthquake occurs
--- Stocking up on emergency supplies beforehand
such as food, water,
flashlights,
bandages and medicine, tents and sleeping bags
Additionally, when a
significant earthquake is expected, government agencies could
have the extremely serious responsibility of evacuating an
entire city. So, they would need to know how likely it is
that an expected earthquake will actually occur at some location
during a given period of time.
When an earthquake is
forecast, the person or group doing the forecast needs to
provide expected forecast accuracy and reliability information
along with location, time window, and magnitude
information. The general public might not be able to tell
the difference between a 99%, a 9.9%, and a 0.99% chance that an
earthquake is going to occur. But government scientists
would understand that type of information. Yet, it has
been my experience that when earthquake forecasters around the
world circulate their forecasts, they rarely if ever include
data regarding the expected accuracy and reliability of the
forecast even though they might be aware that they are basing
their forecast on
elusive and deceptive precursor data.
The
Multiple
Earthquake Precursors Data Evaluation Forecasting Method
can probably often be used to deal with elusive and
deceptive earthquake precursors. But, earthquake
forecasters should also use some common sense, logic, and
discretion when they circulate their forecasts.
--- Forecasters need to make certain that they have a
good understanding of the reliability of their precursor data.
Then they can
include important accuracy and reliability information with
their forecasts.
--- Forecasters need to determine who
will be seeing their forecast before they circulate it, and
then make the necessary adjustments to the style and content
of the forecast.
For example, certain types
of forecast data can be circulated to the general public without
causing problems. When forecast data are exchanged by
private E-mail between scientists it is usually safe to speak
freely and include a wide variety of data. With those
communications between scientists it is not so important that
forecast accuracy and reliability information be included.
Many years ago, before I
began circulating earthquake forecast information in public
forums I first got a legal opinion from a Civil Rights attorney
regarding predicting earthquakes in the United States. He
stated that in the United States, earthquake forecasts are "
Protected
Speech" under the First Amendment to the U.S.
Constitution. That means that earthquake forecasts can be
legally made, circulated, and discussed in public.
That is apparently not the
case in some other countries where people cannot legally discuss
earthquake forecasts in public. Also, in some parts of the
United States it apparently necessary to have legal permission
before you can
sell earthquake forecasting data.
Problem # 2
- A Lack Of Communications Resources
Within some government
there might be communications channels that make it possible for
government researchers to share earthquake forecasting
information with one another. But those resources do not
appear to exist for the general public. Nor do they exist
for independent researchers and groups of researchers. The
researchers and forecasters have to rely on E-mail notes and
messages posted to Web sites in order to communicate with one
another.
That “
Lack of
Communications Resources” problem can make it difficult or
even impossible for earthquake forecasting researchers to
efficiently and effectively share data with one another.
My own repeated efforts
over the years to create Internet bulletin boards, forums, or
blogs that would make it possible for earthquake forecasting
researchers to more effectively share their forecast data with
one another have been largely unsuccessful.
No one, anywhere appears to
have the time, interest, or communications skills needed to
create an effective Internet-based communications resource that
would have all of the options needed by the earthquake
researchers around the world.
Problem # 3 -
Chronic Lacks Of Leadership And Positive Actions
For a very long time, many
government officials and people in the international scientific
community have insisted that: "
Earthquakes Can't Be
Predicted. And it is not going to be possible to predict
them at any time in the foreseeable future."
One of the main reasons
that so many scientists and news service around the world keep
insisting that that is the case is because
they are often
more afraid of the earthquake forecasts than they are of the
powerful and destructive earthquakes!
Scientists can be so afraid
of making a prediction, having it fail, and then being
criticized by their government agency employers or their
colleagues that they can go and generally have gone into a state
of paralysis! And that has created an atmosphere where it
can be extremely difficult to make any progress.
The scientists also don't
appear to understand that it with a little time and effort, it
is actually possible to learn learn how to discuss controversial
subjects such as earthquake forecasting in public without
getting the general public and government officials upset.
My own first formal
Earthquake Warning was sent to U.S. Government personnel on
December 30, 1994, several weeks before the devastating January
16, 1995 Kobe, Japan earthquake. And I have circulated
quite a few other Earthquake Warnings and Advisories in public
any by private E-mail notes. As far as I am aware, none of
them ever resulted in the general public getting upset because I
was careful regarding exactly what types of information were
included in the warnings and advisories circulated to different
groups.
An unfortunate outcome of
the insistence of so many that "
Earthquakes Can't Be
Predicted" is the fact that the attitude of many people
is, "
Why waste time and money on trying to do something that
'everyone' agrees is impossible?"
Fortunately that "
impossible
goal" type of attitude is not shared by all members of the
international scientific community. Not "
everyone"
believes that efforts to learn how to forecast earthquakes are a
waste of time and money.
In spite of the fact that a
powerful and unexpected earthquake occurring at any number of
locations in the United States could result in tremendous number
of fatalities and hundreds of billions of dollars worth of
damage, as far as I am aware,
there is not even one
scientist working for the U.S. Government who is responsible for
looking around on the Internet etc. to see if anyone, anywhere,
is making any progress with forecasting earthquakes.
It is my opinion that many
of the problems holding back the science of forecasting
earthquakes are associated with international scientific
community-related earthquake forecasting politics.
EARTHQUAKE FORECASTING
MYTHS, AND FREQUENTLY
QUOTED BUT DANGEROUSLY INACCURATE
BELIEFS
MYTH # 1 - Earthquakes
Can't Be Predicted
As stated in another
section of this Web page, it is relatively easy for any
earthquake forecaster or forecasting group to prove that "
Earthquakes
CAN Be Predicted." All he, she,
or they need to do is generate one verifiable, accurate
earthquake forecast. And many verifiable, accurate
forecasts have been generated over the years.
On the other hand, both in
theory and reality, it is virtually impossible for anyone to
accurately state that "
Earthquakes Can't Be Predicted."
In order to do that he or would first need to do a detailed
analyses of each and every one of the many earthquake
forecasting technologies that have been developed over the years
and prove that not one of them has ever been used to generate a
single, accurate earthquake forecast.
MYTH # 2 - No One Has Ever
Predicted An Earthquake
The
Proof That Earthquakes Can Be And Are
Being Predicted section of this Web page
briefly discusses a number of past accurate earthquake
predictions. Those forecasts clearly show that Myth # 2 is
in reality nothing but an excuse that some scientists and
government officials propagate largely because they feel that it
provides them with an acceptable reason for not spending any
time and energy on trying to learn how to predict earthquakes.
MYTH # 3 - Every Worthwhile
Earthquake Forecast Must Contain Accurate Time
Window, Location, And Magnitude Information
That dangerous claim is not
only an inaccurate and misleading one, but one that has likely
resulted in the unnecessary loss of many lives to earthquakes
over the years. It is often used as an excuse to justify
ignoring valuable, but supposedly "
incomplete" earthquake
forecasting data.
In reality, Any
accurate and reliable earthquake forecasting information can
be invaluable. It can be used as a starting point for
generating a complete forecast that does contain
Time Window, Location, and Magnitude information.
For several examples:
--- If it is known from precursor data or fault
zone strain data that a powerful earthquake is likely to occur
within some reasonable period of time such
as during the next month, a global search can be made for
other precursor data that can indicate where
the expected earthquake is going to occur.
--- If the location of an
expected earthquake is known, forecasters can begin monitoring
that area for additional precursors that will indicate when
the earthquake is going to occur.
As explained in the
Forecasting
Earthquake Aftershocks section of this Web page,
significant aftershocks for powerful earthquakes are especially
easy to predict because the
locations of the
aftershocks are already accurately known. It is only
necessary to watch those areas for precursors that will indicate
when the significant aftershocks are getting ready
to occur.
HOW EARTHQUAKES ARE BEING
TRIGGERED
Earthquake triggering
processes appear to be
highly complex. The
following sections of this Web page are intended to simply provide
introductory
discussions of a number of earthquake triggering
processes-related topics.
Planetary
Position Related Earthquake Triggering Processes
Gamma Ray Bursts And Earthquake
Triggering
A Proposed
International Earthquake Triggering Processes
Related Research Group
The
following specific topics will be discussed in this section:
--- Why earthquakes occur
--- What is happening in a fault zone before an
earthquake
--- Sun and moon gravity-related earthquake triggering
processes
--- The Tide Generating Force, the
Gravity Point,
and the
Sublunar and
Subsolar Points
--- Ocean Tides and Atmospheric Tides
--- Solar and geomagnetic storm effects on earthquake
triggering
--- Earthquake triggering time windows and cycles
--- Earthquake and nuclear test-related shockwaves
--- A proposed international
Earthquake Triggering
Processes-Related Research Group
Definitions Of Terms Used In This Section
Web page visitors who
do not like the science of physics might want to to skip
over the moderately complex and lengthy technical
discussions in this present section and go to the
Why Earthquakes Occur
section.
The following
definitions are not necessarily in formal use by the
international scientific community. But they are
needed for the discussions in this present section of this
Web page.
A few of the
definitions such as "
The Gravity Point" will likely
be difficult for many Web page visitors to understand,
including even people who
do
like the science of physics.
A number of picture
charts have been included in this section. They should
help with the explanations of what the
Subsolar and
Sublunar Points etc. represent.
Subsolar Point - If a line is drawn
between the center of the Earth and the center of the sun
then the
Subsolar Point is the location on the
surface of the Earth where that line crosses the Earth's
surface.
Subsolar Point Longitude - This is the
longitude of the
Subsolar Point. Its latitude
is ignored.
Sublunar Point - If a line is drawn
between the center of the Earth and the center of the moon
then the
Sublunar Point is the location on the
surface of the Earth where that line crosses the Earth's
surface.
Sublunar Point Longitude - This is the
longitude of the
Sublunar Point. Its latitude
is ignored.
The picture chart below
shows where the
Subsolar and
Sublunar Point
Longitudes are located. This is what you would
see if you were in outer space above the North Pole or the
South Pole and you were looking down at the Earth.
Gravity Strength - The gravity force or
attraction between two masses is associated with the
second
power (the
square) of the distance between the
centers of those two masses. The sun's gravitational
pull on the Earth is
many times stronger than
the moon's gravitational pull on the Earth.
Tide Generating Force - This force is
associated with the
third power of the distance
between two masses such as the moon and the Earth. And
so, even though the sun's gravitational pull on the Earth is
many times stronger than the moon's gravitational
pull on the Earth, the
Tide Generating Force
associated with the moon's gravity is roughly 2.5 times as
strong as that the
Tide Generating Force associated
with the sun's gravity.
The
Gravity Force
and the
Tide Generating Force are not strong enough
to lift anything on the surface of the Earth to any
appreciable extent. Instead, the
Tide Generating
Force draws or propels ocean water and to a certain
extent the Earth's crust
towards the
Sublunar
and
Subsolar Points,and locations on the opposite
side of the Earth from the. And it draws water and so
some extent the Earth's crust and
away from the
locations on the surface of the Earth that are farthest from
those points.
Those "
farthest away"
locations are very roughly 90 longitude degrees to the east
or to the west of the
Sublunar and
Subsolar
Points.
That movement of the
ocean water and to some extent the Earth's crust causes
bulges to occur in the
oceans and on land. And it is what causes
Ocean
Tides and the
Solid Earth Tide to be observed.
Gravity Point - This is the location on
the surface of the Earth where the
combined Tide
Generating Forces of the sun and the moon are
strongest. Because the
Tide Generating Force
associated with the moon gravity is roughly 2.5 times
stronger than that of the sun, the
Gravity Point is
always within about 25 degrees in latitude and longitude of
the location of the
Sublunar Point.
In contrast, because
the sun's gravity pull on the Earth is so much stronger than
that of the moon, the point on the Earth's surface where the
combined
Gravity
Strengths of the sun and the moon is strongest is
always near the
Subsolar Point.
Earth And Moon Barycenter - This is the
location around which both the Earth and the moon actually
rotate once each month. Because the Earth's mass is
considerably greater that of the moon, that location is
roughly on a line drawn between the centers of the Earth and
the moon and a certain distance down beneath the surface of
the Earth. That rotation point is
not at the center of the
Earth.
The
Gravity Point
and other of the other above locations can be seen in the
drawing below.
--- The movement of tectonic plates relative to one
another and other processes cause strain to build in
earthquake fault zones around the world.
--- Various obstacles such as the resistance of rock
layers to smoothly slip past one another cause that strain
energy to build to critically high levels in fault zones.
--- Enough strain eventually accumulates in the fault
zone rock layers to overcome those obstacles. And some of
that stored energy is abruptly released in the form of a
powerful earthquake.
Earthquakes Are Often Being Triggering By Various Forces
It is believed by many
that earthquake occurrence times are random events that have
nothing to do with forces such as the gravitational pulls of
the sun and the moon on the Earth's crust. However, as
this section of this Web page will demonstrate, my own data
and other researchers' data clearly show that many
earthquakes, especially the most powerful ones, likely occur
after events taking place outside of the fault zone add some
additional temporary or permanent strain to the fault
zone. That then pushes the fault zone rock layers to
the breaking point causing them to fracture, resulting in an
earthquake.
There appear to me to
be many,
many different forces and phenomena that
can affect earthquake triggering times. Just a few of
more important forces and phenomena are being discussed
here.
Sun And Moon Gravity Related Earthquake Triggering Processes
As stated above, there are
probably quite a few scientists who believe that earthquake
occurrence times are totally random events. They feel that
earthquakes occur
only when there is sufficient fault
zone strain buildup to finally cause the fault zone rock layers
to abruptly fracture. They believe that there are no
actual
Earthquake Triggering mechanisms.
That opinion is
incorrect!
My own data such as ones
associated with two destructive
1999 Turkey Earthquakes,
and other people's data clearly show that powerful earthquakes
are often being triggered by forces related to the gravitational
pulls of the sun and the moon on the Earth.
Those forces add enough
additional strain to a fault zone over a short period of time
that it causes an earthquake that is getting ready to occur
anyway to be triggered at a specific time. And my data
indicate to me that that triggering time can be accurate to
perhaps plus or minus 5 minutes within a 6.25 hour period of
time.
The drawing below shows how
forces related to the gravitational pulls of the sun and the
moon on the Earth's crust such as the
Tide Generating Force
are probably triggering a good percentage of our earthquakes.
A fault zone running east
and west (EW) could fracture when the gravitational pulls of the
sun and the moon pull it towards the north and the south at the
same time. And a fault zone running north and south (NS)
might fracture when the gravitational pulls of the sun and the
moon pull it towards the east and the west at the same time.
If my
understanding of this is correct, as the Earth rotates each
day on its North and South Pole axis, the Earth's crust and
ocean water on the side that is rotating towards
the Gravity Point are accelerated in its direction
by the sun and moon gravity while the crust and the ocean
water moving away from the Gravity Point are
decelerated or slowed. Strain is then created at
specific locations in the crust. And as the above
drawing proposes, earthquakes can be triggered in fault
zones at locations where that strain causes the crust to be
bent, stretched, or compressed in just the right directions.
Earthquake Triggering Charts
With the
Three Window
Viewer below, and the charts below the viewer, the
longitude of a line peak on a given earthquake line indicates
that my computer programs determined that that particular
earthquake was triggered by sun and moon gravity-related forces
that were similar to the sun and moon gravity-related forces
that triggered earthquakes that occurred in the past at the
longitude of the line peak.
These types of charts are
easy to generate for powerful or destructive earthquakes.
And the charts can be helpful for comparing powerful and/or
destructive earthquakes with their foreshocks and aftershocks in
order to determine if any of them were triggered by similar
combinations of sun and moon gravity-related forces.
It takes a while to develop
an understanding of the data on the charts. But just as
tree ring records and ocean bottom core samples can be studied
for clues regarding what has taken place in the past, these
charts can provide valuable information regarding earthquake
triggering processes and also certain types of earthquake
precursors.
At the present time these
chart data can only be generated by the computer programs that I
myself have developed (with the assistance of a retired computer
programmer). They are not available from any other
source. The programs themselves and the basic program code
are available through my Web sites. And they are free for
researchers and organizations around the world to use.
To use the viewer below,
move the earthquakes
in the upper windows up and down until one of them, such as the
destructive
March 11, 2011 Japan earthquake is visible in the window.
Then move the
earthquakes in the second windows up and down so that you can
compare one of
those
earthquakes with the one in the upper window. The bottom
window can be used in the same way and might also be helpful.
As shown in the chart
below, the extremely powerful and destructive March 11, 2011
Japan earthquake line has a strong line peak around 142 E, the
same longitude as the earthquake. That likely indicates
that it was triggered by sun and moon gravity forces that were
typical for past earthquakes that occurred around the 142 E
longitude line.
In contrast, the March 9,
2011 7.3 magnitude Japan are earthquake and the April 7, 2011
7.0 magnitude Japan area earthquake have line peaks at different
longitudes than where they occurred. That means that they
may have been triggered by sun and moon gravity-related forces
that were
not as
common for earthquakes that occurred at their longitude, 142 E
and 143 E.
However,
the 6.0 and 6.2 magnitude March 9, 2011 Japan area earthquakes
do look like they
were probably triggered by the same sun and moon gravity-related
forces
as the destructive March 11 Japan earthquake.
The chart below shows line
peak information for the two destructive April and May, 2015
Nepal earthquakes plus similar data for several high intensity
EM Signals.
After seeing those EM
Signal data, on May 8, 2015 I circulated a warning for a
possible approaching powerful aftershock in Nepal. And it
appears that the expected potentially destructive aftershock
occurred four days later, on May 12, 2015.
The first two EM Signals
(line #s 3 and 4) matched the first Nepal earthquake. The
third signal (line # 2) matched the approaching aftershock.
The chart below compares a number of Nepal area earthquakes that
occurred during 2013 through part of 2015 with quite a few high
intensity EM Signals that were detected during early 2015.
The red rectangles on the
chart highlight the first destructive 2015 Nepal earthquake and
two EM Signals that were detected after it occurred that matched
the earthquake. A Nepal aftershock warning that I
circulated on May 8, 2015 was based in part on those two EM
Signals.
The chart also enables Web
page visitors to see the large number of high intensity EM
signals were being detected around that time. It is
unusual to have so many signals detected like that for one month
after another.
The chart below is my
Year Chart for the year
2015. It displays averaged records of EM Signals detected
during 90 day periods of time that are offset 10 days from one
another, along with significant earthquakes. The latest
Year Charts can be seen on
my
Data.html
Web page.
The second orange line on
the chart at around 160 E shows that prior to both of the
destructive 2015 Nepal earthquakes there was a consistent
pattern of line peaks that indicated that a significant
earthquake might be about to occur somewhere.
Unfortunately, the longitudes of those types of line peaks match
the actual longitudes of the earthquakes the EM Signals are
associated with only part of the time.
The top, or first, orange
line on the chart at around 75 W shows that after the second
destructive Nepal earthquake occurred, the longitude of one of
the line peaks abruptly changed. I believe that such an
abrupt change in line peak longitudes following the second
earthquake
clearly
indicates that EM Signals that were being detected around that
time were pointing to the approach of one or both of those
destructive Nepal earthquakes.
The Sun - Earth - Moon Angle
The
Sun - Earth -
Moon Angle values for data discussed in this section of
this Web page were generated by a computer program created by a
retired professional computer programmer and myself. Free
downloadable copies of that computer program can be found at the
following Web page address:
http://www.earthquake-research.com/rh/SunGP.html
The
Gravity Point
explanation on that Web page needs to be updated. I don't
recall if the computer program version available through that
Web page has been updated so that the sun - Earth and moon -
Earth distances are included in the
Gravity Point
calculations. However, they were included in all of the
data displayed on this present Web page.
The drawing below
shows what the
Sun - Earth - Moon Angle being discussed
here represents.
Sun - Earth - Moon Angle - In the discussions
in this section of this Web page it is defined as the angle
formed by lines drawn between the centers of the sun and the
Earth, and the moon and the Earth. Only the
longitudes
of the
Subsolar and Sublunar Points are considered when
those lines are drawn.
If an observer in
outer space were studying the
Sun - Earth - Moon Angle
then he or she could do that most easily at locations directly
above either the North Pole or the South Pole.
And so, in the above
drawing, the illustration on the left shows a
Sun - Earth -
Moon Angle value of + 45 degrees. The one in the
center has a value of - 90 degrees. And the one on the
right has a value of + 135 degrees.
Calculating the
Sun -
Earth - Moon Angle while ignoring latitudes is important
because the sun can be above 0 degrees longitude and + 10
degrees latitude while the moon is above 0 degrees longitude and
- 10 degrees latitude. If latitudes are ignored then the
Sun
- Earth - Moon Angle value in that case would be 0
degrees. If latitudes were taken into account as well as
longitude then the
Sun - Earth - Moon Angle value would
be 20 degrees. And my earthquake forecasting computer
programs would not work with values that included the latitude.
The Sun And Moon Are On The Same Side As, Or On The Opposite
Side Of The Earth - If a plane (or disk)
is drawn through the center of the Earth, and that plane is
perpendicular to a line drawn between the centers of the sun and
the Earth, then if the moon is on the
same side
of that plane as the sun (as with the + 90 degree illustration
in the drawing above), then with all of these discussions the
moon is regarded as being on the
same side of the
Earth as the sun.
If the moon is on the
other
side of that plane as with the + 135 degree illustration above
then the moon is regarded as being on the
opposite
side of the Earth as the sun.
Subsolar and
Sublunar
Point latitudes likely have some importance for
earthquake triggering process. But they do not appear to
me to be anywhere near as important as
Subsolar and
Sublunar
Point longitudes. And so, only
longitudes being are considered in these discussions.
Earthquake Triggering And Earthquake Magnitudes
Data presented in this
section of this Web page will show that it appears that:
--- More than 50% of the
time, 7.5 and higher magnitude earthquakes are being triggered
by forces associated with the gravitational pulls of the sun
and the moon on the Earth.
--- That sun and moon
gravity-related earthquake triggering effect is easier to see
when only 7.9 and higher magnitude earthquakes are evaluated.
--- That triggering
effect is even easier to see than that when only 8.2 and
higher magnitude earthquakes are evaluated.
--- With earthquakes
that had 8.4 and higher magnitudes and also with ones below
7.5 magnitude, that sun and moon gravity-related earthquake
triggering effect is not clearly observed in the data being
presented here.
In my opinion,
the data being presented here probably represent the
simplest
test for sun and moon gravity-related earthquake triggering
effects that anyone could run. Actual earthquake
triggering process are more complex. But these data
clearly demonstrate that those triggering effects exist and that
they can be observed, measured, and studied.
My earthquake database file
presently contains data for about 110,000 five and higher
magnitude earthquakes that occurred from the beginning of 1973
to the present. And in one variation of that file the
earthquakes have been sorted by magnitude with the highest
magnitude ones at the top of the file.
Sun - Earth - Moon Angle
values (longitude only) were calculated for all of the high
magnitude earthquakes. And they were divided into the two
groups. The actual location of the earthquake was not
considered with either group, only the value of the
Sun -
Earth - Moon angle when the earthquake occurred.
First Group - The Same Side
Of The Earth - As explained in the earlier
discussion, the first group consisted of earthquakes that had
Sun
- Earth - Moon Angle values in the range - 90 to + 90
degrees. And so, with those earthquakes
the sun and
the moon were on the same side of the Earth
when the earthquake occurred.
Second Group - The Opposite
Side Of The Earth - The second group
consisted of earthquakes that had
Sun - Earth - Moon Angle
values in the range + 90 to 180 degrees, and 180 to - 90
degrees. And so, with those earthquakes
the sun and
the moon were on opposite sides of the
Earth when the earthquake occurred.
With the five charts shown
below, a vertical scale (Y axis) value of 50 or more at a
specific magnitude value means that more than 50% of the
earthquakes having that magnitude and higher magnitudes occurred
when the
Sun - Earth - Moon Angle value was in the range
- 90 to + 90 degrees. The greater the distance above 50,
the greater the percentage of earthquakes that were in that
angle range.
The number of earthquakes
used in the calculations can be seen from the chart's X axis.
In the first chart below,
earthquakes in the 7.8 to 9.0 magnitude range are
displayed. And as can be seen by the vertical line values
that are mostly above 50, the majority of these high magnitude
earthquakes were triggered when the sun and moon were on the
same
side of the Earth. So the combined gravitational pulls of
the sun and the moon on the Earth's crust would have been
strongest at the time of the earthquake.
Remember, the actual
location of the earthquake is not being considered here.
Earthquakes in the 8.4
magnitude and higher ranger did not display that clear
earthquake triggering trend. There were probably too few
of them to provide a meaningful sample.
The chart below shows that
most 7.5 magnitude and higher earthquakes also tended to occur
when the
Sun - Earth - Moon Angle values was in the - 90
to + 90 degree range. The sun and the moon were on the
same side of the Earth when the earthquake occurred.
The chart below shows that
this earthquake triggering trend largely disappears when all
earthquakes having 7.2 and higher magnitudes are
considered. Roughly equal numbers occurred when the
Sun
- Earth - Moon Angle was in the - 90 to + 90
degree range as occurred when it
was not in that range -
that is - when the sun and moon were on
opposite sides
of the Earth.
The two charts below for
7.0 and 6.0 and higher earthquakes show that an observable
earthquake triggering effect continues to
not be observed
as lower and lower magnitude earthquakes are studied.
The extremely simple
studies displayed above clearly show that sun and moon
gravity-related earthquake triggering effects can be observed
when higher magnitude earthquakes are examined. More
complex studies such as the one associated with the chart below
also show that these types of triggering effects can be observed
with many earthquakes having 7.5 and lower magnitudes.
With the chart below, the
similar locations of the line peaks for the two destructive
Turkey earthquakes and
one EM Signal indicate that they were all controlled by the same
combinations of forces associated with the gravitational pulls
of the sun and the moon. And the 7.2 magnitude aftershock
is well outside the 7.5 and higher magnitude range in the above
charts where sun and moon gravity-related earthquake triggering
effects can be easily seen.
Earthquake Triggering Forces Related Time Windows And Time
Cycles
--- Various time windows or time cycles often control the
times when earthquake triggering forces have their maximum and
minimum values.
--- The actual earthquake occurrence time window is
often
finally determined by strain that is temporarily or permanently
added to the fault zone by forces or phenomena that are directly
and/or indirectly associated with the gravitational pulls of the
sun and the moon. Some of those phenomena would be ocean
tides and the Solid Earth Tide.
--- Sun and moon gravity-related forces and phenomena can
reach high and low strength points in a number of different time
cycles that exist at the same time. Several of the most
important cycles are multiples of roughly 6.25 hours in length
(including 24 hours and 50 minutes) and multiples of about 7
days in length (including 28 days).
The picture chart below
shows how important, accurate, and repeatable various earthquake
triggering processes can be during these time cycles.
As the Line #s 1 and 2 line
peak longitudes on the right side of the chart show, my computer
programs indicate that both of those highly destructive Turkey
area earthquakes were triggered at virtually the same points in
one of the 6.25 hour time cycles in spite of the fact that the
earthquakes occurred three months apart from one another.
Line #s 3, 4, 2, 5, and 6
show how different those line peak shapes would look compared
with one another if the second earthquake had occurred as little
as 15 minutes earlier or later than it did.
--- As stated earlier, a number of time cycles having the
same time length can be active at a given time. For
example, one 6.25 hour cycle may be controlled by the position
of the moon in the sky while at the same time another 6.25 hour
cycle is controlled by the locations of ocean tide crests and
troughs.
---
Which time
cycles will
control earthquake occurrence times in a
given fault zone system, is strongly related to how forces and
phenomena related to the time cycles cause different rock layer
sections in the fault zone system to be bent, stretched, or
compressed in relation to one another. Another way of saying
that is to state that what might be described as time
cycle-controlled
Pressure Waves within the Earth's crust
are actually triggering many earthquakes.
--- It has been proposed by at least one researcher that
in most cases earthquake occurrence times are linked with points
of
high and low strain
in the time cycles while a smaller percentage of earthquake
occurrence times are linked with the times when time
cycle-related earthquake triggering forces are experiencing
their
most rapid change
in strength.
--- Powerful aftershocks are
often controlled by
the same sun and moon gravity-related forces and time cycles as
the original powerful earthquake.
--- External forces or phenomena such as ocean and
atmospheric tides, atmospheric storm-related wind drag on
continents, and fault zone rock layer heating associated with
solar and geomagnetic storms etc. can temporarily or permanently
add or subtract sufficient amounts of strain energy to or from
the fault zone to move an earthquake occurrence time forward,
and at times probably backwards, hours, days, or weeks in time.
--- Forces or phenomena such as shockwaves from powerful
earthquakes occurring around the world and perhaps nuclear tests
can produce permanent instabilities in a fault zone and move the
earthquake occurrence time forward or backwards days, weeks,
months, decades, or perhaps even centuries in time.
--- When different forces or phenomena move an
earthquake's occurrence time forward or backwards in time from
when it would have ordinarily occurred, that occurrence time can
shift to another distinct time window that is controlled by sun
and moon gravity-related forces. Shift like that
often
do not involve arbitrary amounts of time.
THE ROLES THAT SOLAR AND
GEOMAGNETIC
STORMS HAVE IN TRIGGERING
EARTHQUAKES
It is likely universally
accepted by the international scientific community that powerful
earthquakes involve the sudden and at times catastrophic release
of accumulated strain energy that has been stored for years,
decades, or even tens of thousands of years in the rock layers
of earthquake fault zones. The rock layers abruptly
fracture and send different types of powerful shockwaves in all
directions.
My own data and data
collected by other researchers clearly show that the occurrence
times of many of our powerful earthquakes and their aftershocks
are not simply random events. The earthquakes are often
triggered, sometimes repeatedly, by certain combinations of sun
and moon gravity-related forces that can bend, twist, stretch,
and compress earthquake fault zones via Solid Earth Tide and
perhaps ocean tide-related forces etc.
There also appears to me
and other researchers to be clear evidence that and/or
geomagnetic storms can somehow affect fault zones so that
earthquakes occur in them months and perhaps even years before
they might have if the storms did not occur when they did.
The June, 2016 issue of the
NCGT journal reports that significant percentages of our
powerful earthquakes occur after strong solar events are
observed.
http://www.ncgtjournal.com/
June Issue
My own theories also
propose that in some case those solar events or storms can
probably actually delay the onset of an earthquake.
Question: How do solar and geomagnetic storms “trigger”
earthquakes and cause them to occur before they would if there
had not been a storm?
One Proposed Answer: The only theory that I
have seen discussed to explain this proposes that the solar
and geomagnetic storms send electric energy through the fault
zones after the storm energy enters the Earth’s crust.
That electric current then causes heating in the fault zone
rock layers. And the heating causes the already stressed
rock layers to perhaps expand and then fracture.
In connection with that
theory I myself would propose that when electric energy is
present in the fault zone it might be altering the chemistry of
the rock layers resulting in their weakening to the point where
they are more inclined to fracture under the accumulated stress.
I don’t know if anyone else
has proposed that
chemistry
change theory.
There are several other
theories related to solar and geomagnetic storm induced
earthquake triggering that I have formulated. They should
be easy to check. And I have been asking other researchers
around the world if any of them would like to check those
theories and perhaps publish a technical paper on the subject
matter.
If no one ever accepts that
offer I will probably just eventually list those theories in
this section of this Web page.
Earthquake And Underground Nuclear Test Shockwave Related
Earthquake Triggering
Theories have been proposed
that at times when an earthquake fault zone is getting ready to
fracture, shockwaves from powerful earthquakes or underground
nuclear tests can jar the fault zone and cause the approaching
earthquake to occur perhaps weeks, months, or even decades
before it would otherwise have occurred. If that does in
fact happen, then it is possible that nuclear tests conducted
during the last century might have helped keep approaching
earthquakes from having much higher magnitudes. They were
"
forced" to occur (triggered) at points in time when the
fault zones had only limited amounts of energy stored in them.
There are good records of
when nuclear tests were conducted during the past century and
when powerful earthquakes occurred. And it would probably
be fairly easy to determine if some earthquakes are or were in
fact being triggered by earthquake or nuclear test-related
shockwaves.
Planetary Position Related Earthquake Triggering
There are some scientists
who believe that the alignment of our solar system's planets can
have an impact on earthquake triggering times. I myself
did not think that planetary position-related earthquake
triggering effects would likely exist until recently when I came
across a paper that was published several years ago.
Information from that publication combined with my own data and
theories now indicate to me that the alignment of the planets
might in fact have an effect on some earthquake triggering
times. However, those effects probably do not involve
other planets' gravities directly influencing ocean tides and
the Solid Earth Tide. My theories propose that something
else is taking place.
Efforts are presently
underway to determine if any physics and/or earthquake experts
would like to compare notes regarding this subject matter for a
possible publication.
Gamma Ray Bursts And Earthquake Triggering
In early July of 2016
another earthquake researcher (
charking@viser.net)
circulated information related to
earthquake precursors being detected in association with GRBs.
A GRB is an intense burst
of high energy gamma rays (relativistic photons) that are
believed to have their origins in distant galaxies.
Astronomers have proposed that GRBs can be generated when a
massive star collapses and it becomes a
black hole.
The gamma ray beams are so highly focused that they can travel
for billions of years in space and still have a strong impact on
orbiting satellites and on the Earth when the GRB photons hit
the atmosphere.
Considering that
information, a logical question would be:
If solar storms can
affect earthquake triggering times, it that also true for the
gamma ray bursts?
I am not aware of anyone
ever asking that question. The answer could probably be
determined by observation and/or by calculating how much energy
hitting the Earth is associated with the GRBs compared with the
energy associated with solar storms. The GRBs might
involve much less energy.
A Proposed International Earthquake Triggering
Processes
Related Research Group
Determining
exactly
how earthquakes are being triggered is in my opinion such an
important and complex matter that I am proposing to people that
an international Earthquake Triggering Processes-related
research group should be established to focus on those
triggering process. A nonprofit foundation could even be
established that would support this effort.
Members of that research
group could be both professional and amateur researchers.
They would attempt to create a giant computer program that would
rely on equations that would contain information regarding the
importance of the many, many different forces or phenomena that
are important to earthquake triggering processes.
For several examples, those
equations would show the importance of sun and moon gravity
effects and fault zone environmental effects. The fault
zone environmental effects would include fault zone depth,
latitude and longitude, and orientation. The orientation
effects would include information related to the fault zone's
running in a north and south direction or in an east and west
direction, and information related to whether the fault zone
involved tectonic plates that were attempting to slip sideways
past one another or ones that were pressing against one another.
DISASTER AREA ILLUMINATION THROUGH
THE USE OF EARTH ORBITING
MIRRORS
This section of this Web
page has been added to explain how governments and researchers
could develop a resource that would help them with their
responses to natural disasters such as floods, tornadoes, and
earthquakes.
Summary - Specially designed
mirrors could be sent to and then tested by crewmembers of the
International Space Station. Those research and
development-related mirrors would be used to reflect sunlight
down to areas on the surface of the Earth that were in
darkness.
The mirror systems
would eventually have a sufficiently advanced design that a
decision could be made to begin sending enormous mirrors
having designs like that into Earth orbit. Those much
larger mirrors would then be used to reflect sunlight to
disaster-affected areas on the Earth’s surface.
After major disasters such
as floods, tornadoes, and earthquakes, disaster mitigation
workers need to have light available so that they can locate and
rescue people and start repairs on critically important
structures such as hospitals and airports etc.
During daylight hours,
having enough sunlight to locate disaster survivors is usually
not a problem. But at night, rescue workers would need to
get illumination from artificial sources such as floodlights,
flashlights, and flares. Unfortunately, quite often after
a major disaster there is not enough light or even any light
available. As a consequence, rescue workers could and
undoubtedly have on many occasions simply walked past an injured
and unconscious person because there was no way for them to
determine that the injured person was there.
Efforts have been made over
the years to put giant mirrors into orbit around the Earth to
see if they could used to generate sufficient illumination to
make rescue work possible. But as far as I am aware, none
of those efforts has ever been successful. In one such
effort that I myself heard about the rocket being used to launch
the mirror exploded not too long after liftoff.
Small, relatively
inexpensive mirrors could be sent to the International Space
Station to be tested by its crewmembers. Space Station
workers could attach the mirrors to the space station framework
and then run tests on the mirrors or let controllers on the
ground test them using remote control. Light sensors on
the ground would be used to determine which mirror designs
worked the best.
When it was determined that
some mirror system design met the necessary efficiency and
expense requirements, large versions of the mirrors could be
launched into permanent Earth orbit.
Normally those orbiting
mirrors would be aligned so that they would not be reflecting
sunlight to the surface of the Earth. When a disaster
occurred, workers on the ground would send radio signals to the
mirrors that would cause them to change their orientation in
space so that light would be reflected to disaster areas where
it was needed.
People who have taken high
school or college physics could probably easily determine that
when sunlight is reflected from far out in space towards the
surface of the Earth, what results is an image of the sun that
is focused on the Earth’s surface. And that image can be
hundreds of kilometers or miles in diameter. So, a single
large mirror could not be used to focus enough sunlight on any
Earth surface area to be especially useful. Large numbers
of orbiting mirrors would need to be used for that.
Those mirror systems would
generate sufficient light for disaster mitigation workers except
in cases where there were dense, dark clouds in some area.
Enough light would likely make it through other types of clouds.
There are any number of
designs for Earth-orbiting systems and other types of systems
that could generate and focus or reflect light to areas where
disasters have occurred. For example, large drone aircraft
equipped with high intensity LED lights might work. But,
it is possible that Earth-orbiting mirrors would provide the
most practical, most easily developed, and most cost-effective
system. And even if other types of lighting systems such
as drones equipped with LED lights are considered for
development, efforts should still get started as quickly as
possible on the creation of and testing of International Space
Station-related reflecting mirrors.
HOW TO GET THINGS
MOVING RIGHT NOW !!!
CREATE AN EARTHQUAKE
RELATED
DISASTER MITIGATION NONPROFIT FOUNDATION
Summary - This section of this Web page
proposes that an earthquake-related,
relatively small
nonprofit foundation should be created as soon as possible.
Foundation personnel would keep track of and attempt to
accelerate international efforts to deal with the dangers
associated with powerful earthquakes.
Question - Can earthquakes be predicted?
Answer - The answer to that
question can be "Yes" or "No" depending on how you look at it.
As stated repeatedly in
different sections of this Web page, there is plenty of evidence
that earthquakes can be predicted with already existing
earthquake forecasting technologies. But in spite of that
and the fact that it is critically important to develop
effective earthquake forecasting programs, relatively little is
getting done along those lines.
This proposed nonprofit
foundation might have perhaps three to five full-time
administrative, research, and support personnel with a budget of
perhaps $300,000 to $500,000 per year.
--- The nonprofit foundation would not
itself do any earthquake forecasting research and development
work or attempt to generate any earthquake forecasts.
--- The nonprofit foundation would
focus on getting the earthquake destruction-related
disaster mitigation efforts of governments, other
organizations, and individual researchers around the world
better organized and moving forward in a more timely manner.
Specifically, the
nonprofit foundation would collect or generate and then make
available at some Internet Web site:
--- There would be
recommendations for what
governments, organizations, and individuals around the world
could do to more effectively predict earthquakes, prepare for
them, survive them, assist injured and homeless people after an
earthquake, and help with efforts to rebuild residences,
businesses, and entire cities after a destructive earthquake has
occurred.
--- There would be information regarding the following
types of earthquake-related disaster mitigation efforts being
made by governments, organizations, and individuals around the
world.
----- Discussions of existing earthquake forecasting
technologies
----- Discussions of efforts to improve existing
earthquake forecasting technologies
----- Discussions of efforts to develop new earthquake
forecasting technologies
----- Discussions of existing disaster response
capabilities
----- Discussions of efforts to develop more effective
disaster response capabilities
----- Discussions of how to build or modify buildings,
bridges, and utilities such as water, gas, and electricity
lines so that they will remain standing or remain
operational during an earthquake
----- Discussion of efforts to develop more earthquake
damage-resistant buildings and bridges etc.
----- Information regarding disaster relief
organizations that people around the world could donate money
and food to when destructive earthquakes occur
Past Efforts To
Create This Type Of Nonprofit
Foundation
There have been numerous
attempts over the years to create organizations capable of doing
the types of things listed above. However it has been my
personal observation and experience that with virtually all of
those efforts that I myself have ever heard about, people
gradually lost interest in the efforts and they failed for lack
of support. Or, some person or some group of people
objected to the efforts. And the people making the efforts
were then unable or unwilling to deal with that opposition.
General Question - Would YOU have the
necessary qualifications to create and run this proposed
nonprofit foundation?
Specific Question # 1 - Did you understand
any of the theories and data on this Web page?
Specific Question # 2 -
Do you feel that the information on this Web page
provided clear evidence that "Earthquakes Can
Be Predicted?"
Specific Question # 3
- Do you feel that the information on this Web
page has clearly demonstrated that some organization
needs to be created that would enable us to get the
science of earthquake forecasting better organized and
moving forward in a more rapid manner?
If your answer to any of the above questions is "
No" then
it is my personal opinion that you would probably not have the
right type of background and interests to be able to create and
run this proposed, relatively small earthquake disaster
mitigation-related nonprofit foundation.
General Question -
What type of background and interests would a person need to
have to be able to run that type of nonprofit foundation?
Proposed Answers
--- He or she would need to be someone who believes that
earthquake forecasting data collected from unconventional
sources such as psychics, astrologers, earthquake sensitive
humans and animals, from the evaluation of planetary alignment
data, and from the evaluation of ocean and Earth Tide data
might have some value.
Quite often, scientists are
afraid of being criticized or ridiculed by their colleagues for
stating that it might be possible to predict earthquakes.
Or they are afraid of being criticized because they feel that
unconventional earthquake forecasters such as astrologers should
have a chance to have their data considered. And to avoid
any possible criticism and ridicule the scientists limit their
own effectiveness to the point where they are unable to make any
progress.
--- He or she would need to be someone who believes
that doing whatever is necessary and reasonable to keep
people from perishing during or after an earthquake is more
important than simply making money from running a nonprofit
or from running an earthquake forecasting program.