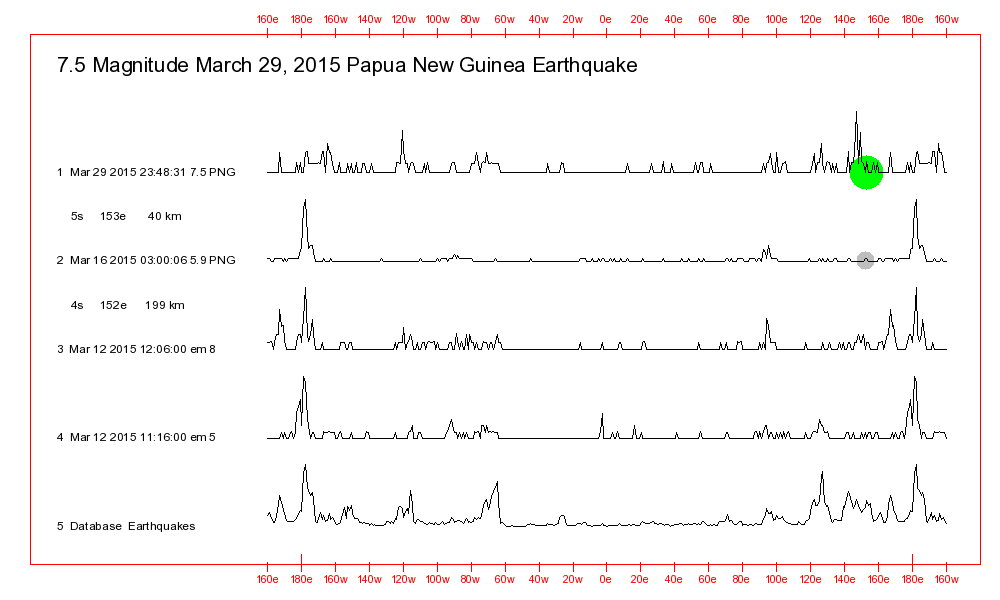
MARCH 29, 2015 PAPUA NEW GUINEA EARTHQUAKE
Latest Update:
May
1, 2015
People visiting this Web page for the first time should read the explanation section so
that they can understand the information in the line charts and the earthquake tables.
Understanding The Precursor Data On This Web Page
2015/03/29 23:48:31 4.76S 152.56E 40 7.5 55km SE of Kokopo, Papua New Guinea
2015/03/16 03:00:06 4.10S 152.04E 199 5.9 17km NW of Rabaul, Papua New Guinea
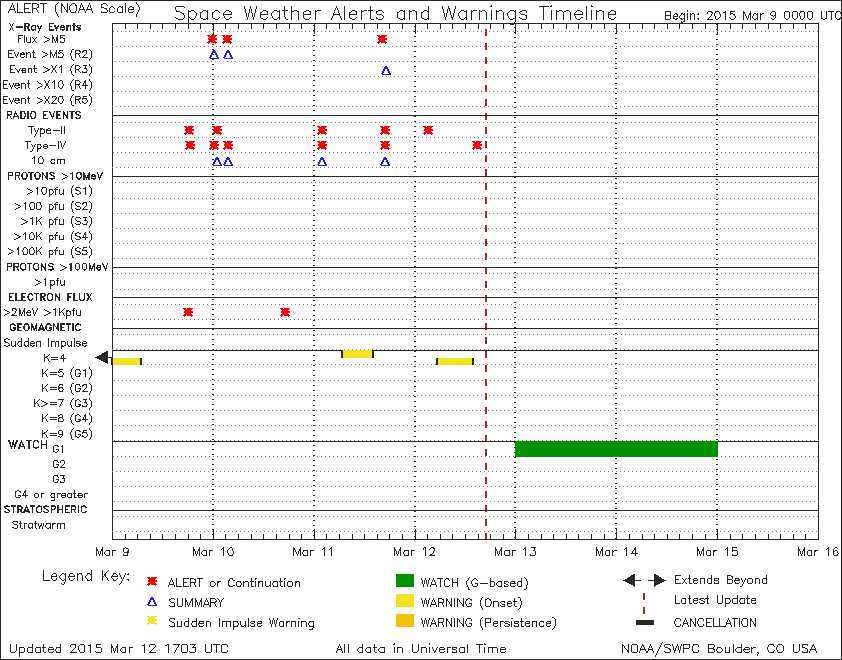
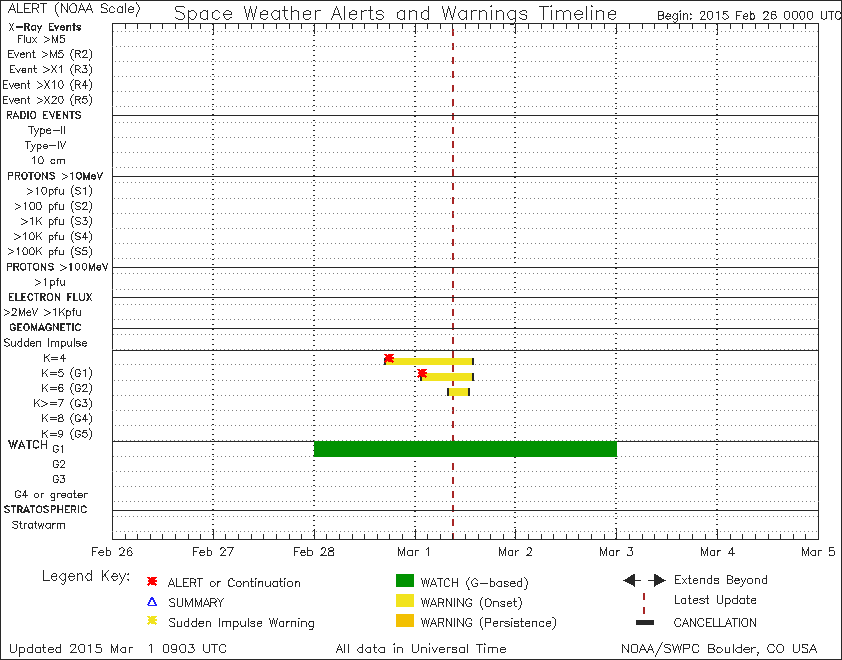
ELECTROMAGNETIC SIGNAL DETECTION TIMES (EM Signals)
The yellow rectangle shaped bars on the NOAA Space Weather Chart
shown below indicate that there was some strong geomagnetic energy
activity on March 12, 2015, the day that the two March 12, 2015 high intensity EM
Signals were detected.
It has been observed that at
times, high intensity EM Signals are detected at virtually exactly the
same time as the times when those small red - orange Alert squares are displayed on the geomagnetic energy lines on these charts.
The high intensity signals
usually have durations of about 20 seconds. And they are
occasionally detected at virtually the exact same time as when a
powerful and distant earthquake occurs.
They seem to have a DC (Direct
Current) type of character and are occasionally detected either before
or after both moderate intensity AC (Alternating Current) type signals
that can have frequencies of perhaps 3 to 10 cycles per second up to perhaps 8000 cycles per second, and low
intensity 0.25 second duration pulse type signals.
Those data indicate to me that
the high intensity EM Signals are fault zone activity related and that
they are likely traveling through the atmosphere at the speed of
light.
The low intensity 0.25 second pulse type signals are likely associated
with earthquake fault zone microshocks (microearthquakes or
microquakes).
The chart below compares those Papua New Guinea earthquakes with those two high intensity EM Signals that were detected on March 12, 2015. Both EM Signals are good matches with the March 16 earthquake. And that suggests that the March 16 earthquake was triggered by the same sun and moon gravity related forces as caused the EM Signals to be generated.
The different line peak shape of the March 29 earthquake and other data not displayed here indicate that it was probably triggered by different sun and moon gravity related forces than were associated with the triggering of the March 16 earthquake and the generation of the two high intensity EM Signals.
The fact that there is a strong line peak just to the east of the March 29 earthquake longitude indicate that it was probably triggered by the sun and moon gravity related forces that are responsible for the triggering of many or most of the past earthquakes that occurred at that longitude.
The table below shows matches between the EM 8 signal detected on March 12, 2015 and more than 700 past earthquakes that produced at least one fatality since the start of 1973.
What is
significant is the fact that the 4th highest probability location in the table is
almost exactly the same location as where the March 16 and 29
earthquakes occurred. Thermal data plots displayed farther down on
this Web page show that had that location been watched for thermal
increases starting on March 12, 2015 it might have been
possible to accurately predict that a powerful earthquake would occur
there in the near future.
COMMENT - My data including some displayed on this Web page indicate that high intensity EM Signals
that might have been associated with the approach of that Papua New
Guinea area earthquake were being detected as far back as late December
of 2014.
2015/03/29 23:48:31 4.76S 152.56E 40 7.5 55km SE of Kokopo, Papua New Guinea
Destructive Earthquakes Matches For The 2015/03/12 12:06:00 EM 8 Signal Pa Pd Fatal Earthquake Data
99 100 2 1997/03/01 6:04:14 39.42N 76.80E 22 5.6
88 89 1 2005/02/01
05:55:21 48.07S 166.02E 12 3.9 OFF WEST COAST OF THE SOUTH ISLAND,
N.Z.
79 80 18 1979/02/16 10:08:54
16.54S 72.55W 55 7.2 near the coast of southern Peru
73 74 2 2000/11/16
04:54:56 3.97S 152.32E 33 8.0 NEW IRELAND REGION, P.N.G.
72 73 1 2004/12/01 23:17:21 3.69S 135.52E 10 5.5 PAPUA, INDONESIA
71 71 1 1980/11/30 07:41:58 40.85N 15.33E 10 5.1 southern Italy
71 71 400 1993/07/12 13:17:11 42.85N 139.20E 16 7.7
69 70 12 2013/09/28 07:34:06
27.18N 65.50E 12 6.8 84km NNE of Awaran, Pakistan
63 64 435 2010/10/25 14:42:23
3.48S 100.11E 21 7.7 KEPULAUAN MENTAWAI REGION, INDONESIA
60 61 3 1990/04/18 13:39:19 1.19N 122.80E 25 7.4
59 59 2266 2003/05/21 18:44:19 36.89N 3.78E 10 6.7 NORTHERN ALGERIA
59 59 5 1988/11/03 14:47:12 13.91N 90.50W 76 6.6 Guatemala
58 59 6 1995/01/19 15:05:03 5.05N 72.90W 17 6.6
58 59 2 1986/08/30 21:28:37 45.52N 26.27E 136 7.2 Romania
57 58 2 1994/07/04 21:36:41 14.89N 97.30W 14 6.5
57 58 9748 1993/09/29 22:25:00 8.07N 76.45E 33 6.3 SOUTHERN INDIA
56 56 5000 1980/10/10 12:25:25 36.14N 1.40E 12 7.1 northern Algeria
56 56 1621 1990/07/16 07:26:34 15.68N 121.10E 25 7.8
54 55 24 1999/12/22 17:36:56 35.32N 1.20W 10 5.7
54 54 6 2000/12/15 16:44:47 38.46N 31.30E 10 6.0
The table below shows matches between the EM 8 signal detected on March
12, 2015 and all 8 and higher magnitude earthquakes that occurred since the start of 1973.
It is highly
significant that the highest probability location in the table is once again almost exactly the same
location as where the March 16 and 29 earthquakes occurred.
2015/03/29 23:48:31 4.76S 152.56E 40 7.5 55km SE of Kokopo, Papua New Guinea
It is
significant that both the # 1 highest probability and 14th highest
probability locations in the table are relatively close to the location
where the March 16 and 29 earthquakes occurred.
2015/03/29 23:48:31 4.76S 152.56E 40 7.5 55km SE of Kokopo, Papua New Guinea
7 And Higher Magnitude Earthquake Matches For The 2015/03/12 11:16:00 EM 5 Signal
Pa Pd Fatal Earthquake Data
86
1995/08/16 23:10:23 5.77S 154.30E 33 7.2
83
2012/04/11 10:43:10 0.80N 92.46E 25 8.2 OFF W COAST
OF NORTHERN SUMATERA
83 99 1 1993/09/10 19:12:54 14.72N 92.60W 34 7.3
80
1975/06/29 10:37:41 38.73N 130.09E 556 7.1 Sea of Japan
79 95 15 1979/09/12 05:17:56 1.69S 135.97E 20 7.5 Biak region, Indonesia
79 94 33 1999/09/30 16:31:13 16.15N 96.71W 33 7.5Ms A OAXACA, MEXICO
78
2011/08/20 16:55:03 18.26S 168.06E 41 7.1 VANUATU
74
1984/10/15 10:21:08 15.87S 173.56W 127 7.1 Tonga
71
2013/10/25 17:10:18 37.15N 144.68E 26 7.1 Off the east coast of
Honshu, Japan
67
1988/02/05 14:01:04 24.79S 70.48W 37 7.2 Antofagasta, Chile
64
2003/11/17 06:43:06 51.33N 178.64E 33 7.8 RAT ISLANDS, ALEUTIAN
ISLANDS
63
2013/09/25 16:42:43 15.84S 74.51W 40 7.1 46km SSE of Acari,
Peru
63
1981/12/26 17:05:31 29.94S 177.65W 21 7.1 Kermadec Islands, New
Zealand
63
1995/08/16 10:27:28 5.80S 154.10E 30 7.8
62 1992/07/18 08:36:58 39.42N 143.30E 28 7.0
59
1983/12/02 03:09:03 14.06N 91.91W 35 7.0 offshore Guatemala
58
2004/12/26 04:21:29 6.88N 92.93E 40 7.1 NICOBAR
ISLANDS, INDIA REGION
58
17Mar2003 16:36:17 51.3 N 177.8 E 33 7.4 M*GSR RAT ISLANDS,
ALEUTIAN
58
1981/05/25 05:25:12 48.72S 164.65E 11 7.6 off the west coast of
the South Island of New Zealand
58 69 35 1988/08/06 00:36:26 25.09N 95.11E 90 7.3 Myanmar
The table below shows matches between an EM 7 signal detected on February 28, 2015 and all 8 and higher magnitude earthquakes that occurred since the start of 1973.
It is significant that the 16th highest probability location in the table is
once again close to the location where the March 16 and 29 earthquakes
occurred, and especially that the EM Signal was detected a full month before
the March 29 earthquake.
2015/03/29 23:48:31 4.76S 152.56E 40 7.5 55km SE of Kokopo, Papua New Guinea
8 And Higher Magnitude Earthquake Matches For The 2015/02/28 20:04:00 EM 7 Signal
The table below shows matches between an EM 7 signal detected on February 28, 2015 and all 8 and higher magnitude earthquakes that occurred since the start of 1973.
It is significant that the 7th, 8th, and 17th highest probability locations in
the table are close to the location as where the March 16 and 29
earthquakes occurred, and especially that the EM Signal was detected a full month before the March 29
earthquake.
2015/03/29 23:48:31 4.76S 152.56E 40 7.5 55km SE of Kokopo, Papua New Guinea
8 And Higher Magnitude Earthquake Matches For The 2015/02/28 17:53:00 EM 7 Signal
The plot below is a gravimeter related gravity strength plot that was sent to me by another earthquake researcher. The actual location of the gravity meter was not included with the data sent to me. But the information included with the plot stated that the gravity of the rock mass started increasing at the beginning of March and continued doing that until the end of March when the 7.5 Papua New Guinea earthquake occurred. The gravity then began to decrease. That then resulted in rock layer stress in Central Europe decreasing.
The low point in
that gravity trace was roughly the same as the time when those two high
intensity EM Signals were detected. And thermal data displayed farther down on this Web page indicate to me that some
significant event likely took place in the Papua New Guinea area fault zone around March 12, 2015 that resulted in high
intensity EM Signals being generated and gravity values starting to increase.
The
researcher who sent me the gravity trace stated that all of his
research group's surface tilt meters (no data shown here) displayed decreases in
deformation rates starting at the beginning of April, 2015, following the earthquake.
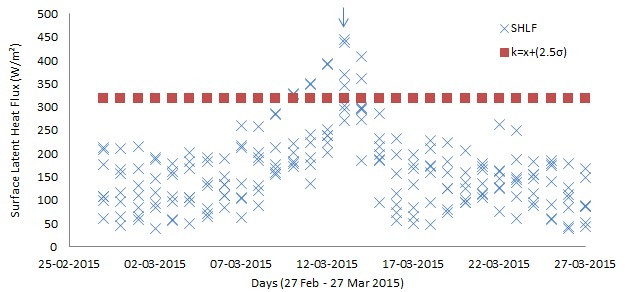
The
plots correspond to a 30 day Time Window going from 2015/02/27 to
2015/03/27 and a latitude and longitude rectangle, 4 N to 4 S, and 148 E
to 156E.
Most
of the thermal anomalies shown on the plots were observed around 4.7 S
and 153.7 E. That location is 136.5 kilometers from the epicenter
of the 7.5 magnitude March 29, 2015 Papua New Guinea area earthquake.
There
is a marked anomaly on March 13, sixteen days before the 7.5 magnitude
March 29, 2015 Papua New Guinea area earthquake occurred and just one
day after the two high intensity EM Signals were detected on March 12.
The plot data indicate to me that something was likely taking place in or around the fault zone for several days before March 12. And whatever it was, it finally resulted in those two March 12, 2015 high intensity EM Signals being generated.
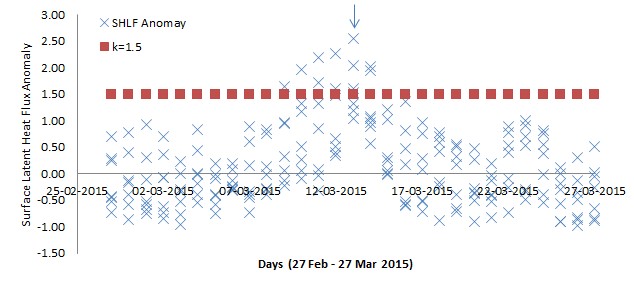
The plot below represents SHLF anomaly data that match the data in the above plot.
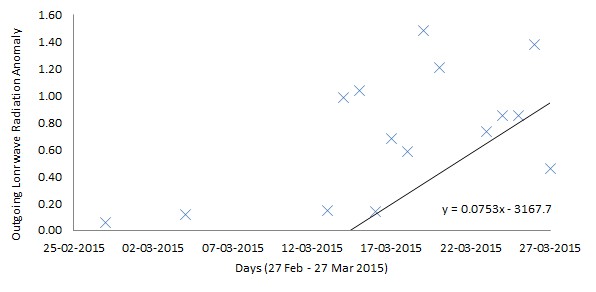
The daily Outgoing Longwave Radiation (OLR) plot below shows a positive increase since March 13, 2015 probably to the date of the earthquake (data were available up to Mar 29).
Return To Earthquake Research Homepage
The first version of this Web page was stored at this site on
April 29, 2015. Comments regarding this Web site are
welcome.
Please send them to: webmaster@earthquake-research.com
The information on this Web page represents expressions of
personal
opinion by the Web page author. The address -URL- for this Web
page is:
http://www.earthquake-research.com/archive/2015-03-29-PNG.html