ELECTROMAGNETIC SIGNAL AND EARTHQUAKE
TABLE DATA
Latest Update:
April
15,
2021
A Web page display Zoom setting of 125% or 150% can
make this Web page's text and table data easier to read.
Earthquake forecasters should then attempt to identify patterns in the Chart Data and the Table Data that would enable them to tell when Significant Earthquakes might be approaching for locations that are important to them such as where they live and work.
Tables for Significant Earthquakes such as the one above going back to the beginning of 1973 can be found on the Significant Earthquakes Web page.
 Table 1                                     Table 2                                                Table 3                                                Table 4                                                Table 5                                                Table 6                                                Table 7                                                Table 8                                                Table 9

 Earthquake   2019/01/20 01:32:51 30.07S  71.42W  53 6.7 "15km SSW of Coquimbo, Chile"
 Table Longitudes                            Fatalities   2

 Qual  Lon 8.0+ 7.5+ 7.0+ 6.5+ 6.0+ 5.0+     Earthquake   2019/01/20 01:32:51 30S 71W 53 6.7        Earthquake   2019/01/20 01:32:51 30S 71W 53 6.7        Earthquake   2019/01/20 01:32:51 30S 71W 53 6.7        Earthquake   2019/01/20 01:32:51 30S 71W 53 6.7        Earthquake   2019/01/20 01:32:51 30S 71W 53 6.7        Earthquake   2019/01/20 01:32:51 30S 71W 53 6.7        Earthquake   2019/01/20 01:32:51 30S 71W 53 6.7        Earthquake   2019/01/20 01:32:51 30S 71W 53 6.7
                                                          Destructive Matches - Quality Sort                     Destructive Matches - Longitude Sort                   8.0+ Mag - Longitude Sort                              7.5+ Mag - Longitude Sort                              7.0+ Mag - Longitude Sort                              6.5+ Mag - Longitude Sort                              6.0+ Mag - Longitude Sort                              5.0+ Mag - Longitude Sort

 Lon  Lon  Lon  Lon  Lon  Lon  Lon  Lon       Pa  Pd  D#  Earthquake UTC Date Lat Lon Depth Mag      Pa  Pd  D#  Earthquake UTC Date Lat Lon Depth Mag      Pa  Pd  D#  Earthquake UTC Date Lat Lon Depth Mag      Pa  Pd  D#  Earthquake UTC Date Lat Lon Depth Mag      Pa  Pd  D#  Earthquake UTC Date Lat Lon Depth Mag      Pa  Pd  D#  Earthquake UTC Date Lat Lon Depth Mag      Pa  Pd  D#  Earthquake UTC Date Lat Lon Depth Mag      Pa  Pd  D#  Earthquake UTC Date Lat Lon Depth Mag
 135E 146E 161E 161E 180E 169E 174E 144E      91 100   4  1995/01/16 20:46:52 35N 135E   22 6.9      79  87   1  1993/10/16 03:05:30  6S 146E   27 6.3      34          1989/05/23 10:54:46 53S 161E    2 8.1      71  78   2  1977/04/21 04:24:09 10S 161E   33 7.5      76          1974/03/23 14:28:34 24S 180E  520 7.0      84          2017/11/19 15:09:03 22S 169E   17 6.6      85          2016/11/13 13:31:26 42S 174E    8 6.2      98          1987/07/09 19:10:24  4S 144E  112 5.0
 136E 140E 161E 149E 161E 160E 172E 143E      88  96   2  1985/09/15 02:42:54  4S 136E   10 6.3      84  93   4  1976/06/25 19:18:56  5S 140E   33 7.1      34          1989/05/23 10:54:46 52S 161E   10 8.2      53          1995/12/03 18:01:08 45N 149E   33 7.9      66          1979/10/23 09:51:08 11S 161E   22 7.0      81          1987/10/06 20:11:36 53N 160E   34 6.5      84          1991/01/28 12:58:48 42S 172E   27 6.0     100          1981/01/19 14:02:35 38N 143E   33 5.2
  71W 136E 155E 149E 161E 150E 169E 142E      87  95   1  2019/01/20 01:32:51 30S  71W   53 6.7      88  96   2  1985/09/15 02:42:54  4S 136E   10 6.3      18          2007/01/13 04:23:21 46N 155E   10 8.1      53          1995/12/03 18:01:08 45N 149E   33 7.9      71  78   2  1977/04/21 04:24:09 10S 161E   33 7.5      81          2013/07/07 20:30:07  6S 150E   62 6.6      84          2017/11/19 15:09:03 22S 169E   17 6.6      95          2012/05/05 20:12:35 38N 142E   66 5.1
  43E 135E 153E 147E 148E 148E 169E 142E      85  93   2  2011/11/09 19:23:33 38N  43E    5 5.6      91 100   4  1995/01/16 20:46:52 35N 135E   22 6.9      34          2006/11/15 11:14:16 47N 153E   27 8.3      54          1978/12/06 14:02:08 45N 147E  145 7.8      82          1992/05/15 07:05:05  6S 148E   58 7.1      82          1992/05/15 07:05:05  6S 148E   58 7.1      85          2007/07/15 09:27:35 15S 169E    8 6.1      94          2001/02/24 21:53:54 37N 142E    0 5.5
 140E 125E 153E 146E 145E 142E 167E 142E      84  93   4  1976/06/25 19:18:56  5S 140E   33 7.1      80  88   1  1977/08/27 07:12:22  8S 125E   25 6.8      34          2006/11/15 11:14:13 47N 153E   10 8.3      58          1973/06/17 03:55:03 43N 146E   44 7.8      68          1995/08/23 07:06:02 19N 145E  594 7.1      81          2008/05/07 16:45:20 36N 142E   37 6.8      84          2018/12/22 14:25:01 13S 167E   42 6.0      96          1995/03/16 08:11:16 42N 142E   20 5.1
  77E 102E 152E 144E 143E 140E 143E 142E      82  90   2  1996/03/19 15:00:26 40N  77E   28 6.3      73  80   2  2008/08/30 08:30:53 26N 102E   11 6.0      37          2000/11/17 21:01:56  6S 152E   33 8.2      47          2003/09/25 19:50:06 42N 144E   33 8.3      63  69   4  1995/05/27 13:03:52 53N 143E   11 7.1      84  93   4  1976/06/25 19:18:56  5S 140E   33 7.1      88          1994/12/31 13:50:23 40N 143E   43 6.0      94          1994/01/12 21:22:37  4S 142E  118 5.0
   7E 100E 152E 144E 140E 139E 140E 142E      80  88   2  1985/10/27 19:34:57 36N   7E   10 5.8      73  80   1  2014/10/07 13:49:39 23N 100E    9 6.1      18  20   1  2000/11/16 04:54:56  4S 152E   33 8.0      47          2000/03/28 11:00:22 22N 144E  126 7.6      84  93   4  1976/06/25 19:18:56  5S 140E   33 7.1      92          1986/03/24 19:31:40  2S 139E   24 6.7      91          2006/10/23 21:17:24 29N 140E   39 6.1      96          1986/06/08 21:33:41 31N 142E   33 5.1
  44E 100E 147E 141E 126E 136E 140E 141E      80  88   3  1991/04/29 09:12:48 42N  44E   17 7.0      77  85   3  1990/04/26 09:37:10 36N 100E   10 6.3      45  49   2  1994/10/04 13:22:55 44N 147E   14 8.3      60          2011/03/11 06:15:40 36N 141E   39 7.9      62          1980/01/02 20:58:43  6N 126E   38 7.0      79          1994/04/13 22:22:29  3S 136E   28 6.5      84  93   4  1976/06/25 19:18:56  5S 140E   33 7.1      94          2010/02/28 08:17:45 35N 141E   10 5.6
 125E  77E 145E 140E 123E 135E 139E 141E      80  88   1  1977/08/27 07:12:22  8S 125E   25 6.8      82  90   2  1996/03/19 15:00:26 40N  77E   28 6.3      40          1993/08/08 08:34:24 13N 145E   59 8.2      57          2015/05/30 11:23:02 28N 140E  678 7.8      70          2017/01/10 06:13:47  4N 123E  613 7.3      91 100   4  1995/01/16 20:46:52 35N 135E   22 6.9      87          2004/10/27 01:40:50 37N 139E   14 6.0      98          1985/08/29 14:10:32 28N 141E   12 5.1
 146E  52E 144E 102E 102E 125E 139E 140E      79  87   1  1993/10/16 03:05:30  6S 146E   27 6.3      75  82   3  1983/03/25 11:57:49 36N  52E   33 5.2      47          2003/09/25 19:50:06 42N 144E   33 8.3      61  67   3  2000/06/04 16:28:26  5S 102E   33 7.9      61  67   3  2000/06/04 16:28:26  5S 102E   33 7.9      80  88   1  1977/08/27 07:12:22  8S 125E   25 6.8      92          1986/03/24 19:31:40  2S 139E   24 6.7      94          2009/01/26 08:54:21 37N 140E  132 5.0
  11E  44E 144E  96E 101E 100E 136E 140E      78  86   1  2012/05/20 02:03:52 45N  11E    6 6.0      80  88   3  1991/04/29 09:12:48 42N  44E   17 7.0      47          2003/09/25 19:50:06 42N 144E   27 8.3      86          2008/02/20 08:08:30  3N  96E   26 7.5      64  70   4  1973/02/06 10:37:10 31N 101E   33 7.4      82          2007/09/13 03:35:28  2S 100E   22 7.0      88  96   2  1985/09/15 02:42:54  4S 136E   10 6.3     100          2001/07/05 02:15:42 32N 140E   33 5.3
  28W  43E 142E  72E 100E  96E 135E 140E      78  85   1  1973/11/23 13:36:19 38N  28W    5 5.1      85  93   2  2011/11/09 19:23:33 38N  43E    5 5.6      41  45   5  2011/03/11 05:46:24 38N 142E   29 9.1      56          1983/11/30 17:46:02  7S  72E   10 7.7      82          2007/09/13 03:35:28  2S 100E   22 7.0      86          2008/02/20 08:08:30  3N  96E   26 7.5      91 100   4  1995/01/16 20:46:52 35N 135E   22 6.9      96          2001/07/05 02:05:49 32N 140E   33 5.3
 100E  11E 118E  72W  96E  44E  96E 139E      77  85   3  1990/04/26 09:37:10 36N 100E   10 6.3      78  86   1  2012/05/20 02:03:52 45N  11E    6 6.0      45  49   3  1977/08/19 06:08:55 11S 118E   25 8.3      59  65   2  2015/09/16 22:54:32 32S  72W   22 8.3      86          2008/02/20 08:08:30  3N  96E   26 7.5      80  88   3  1991/04/29 09:12:48 42N  44E   17 7.0      86          2008/02/20 08:08:30  3N  96E   26 7.5      94          1994/02/10 14:52:14  2S 139E   22 5.0
  52E   7E 101E  73W  44E  11W  11W 138E      75  82   3  1983/03/25 11:57:49 36N  52E   33 5.2      80  88   2  1985/10/27 19:34:57 36N   7E   10 5.8      25  28   2  2007/09/12 11:10:26  4S 101E   34 8.4      60          1975/05/10 14:27:43 38S  73W   30 7.7      80  88   3  1991/04/29 09:12:48 42N  44E   17 7.0      84          2012/08/30 13:43:25 71N  11W   14 6.8      84          2012/08/30 13:43:25 71N  11W   14 6.8      95          1976/11/06 07:57:24 35N 138E  176 5.0
  81W   4E  93E  87W  30W  42W  42W 134E      75  82   2  1974/10/02 02:54:59  6S  81W    5 5.7      73  80   1  1973/11/24 14:05:46 36N   4E   17 5.1      25  27   1  2012/04/11 08:38:36  2N  93E   20 8.6      49  54   3  1992/09/02 00:16:01 12N  87W   45 7.7      64          1996/12/10 08:36:18  1N  30W   10 7.0      88          2008/02/08 09:38:14 11N  42W    9 6.9      88          2008/02/08 09:38:14 11N  42W    9 6.9      94          1974/11/28 13:22:39  2S 134E   17 5.1
  99W  28W  72W  94W  42W  42W  42W  49E      74  81   1  2009/04/27 16:46:28 17N  99W   35 5.8      78  85   1  1973/11/23 13:36:19 38N  28W    5 5.1      59  65   2  2015/09/16 22:54:32 32S  72W   22 8.3      48  53   2  2017/09/08 04:49:19 15N  94W   47 8.2      86          1996/06/02 02:52:09 11N  42W   10 7.1      86          1996/06/02 02:52:09 11N  42W   10 7.1      86          1996/06/02 02:52:09 11N  42W   10 7.1      94          1990/07/06 19:34:52 37N  49E   34 5.3
   4E  71W  94W  97W  66W  66W  71W  47E      73  80   1  1973/11/24 14:05:46 36N   4E   17 5.1      87  95   1  2019/01/20 01:32:51 30S  71W   53 6.7      48  53   2  2017/09/08 04:49:19 15N  94W   47 8.2      72  79   1  1978/11/29 19:52:47 16N  97W   18 7.7      83          1997/01/23 02:15:22 22S  66W  276 7.1      83          1997/01/23 02:15:22 22S  66W  276 7.1      87  95   1  2019/01/20 01:32:51 30S  71W   53 6.7      95          1998/10/04 00:42:47 33N  47E   10 5.3
 102E  81W 104W 102W  72W  71W 128W  43W      73  80   2  2008/08/30 08:30:53 26N 102E   11 6.0      75  82   2  1974/10/02 02:54:59  6S  81W    5 5.7      63  69   2  1995/10/09 15:35:53 19N 104W   33 8.0      48          1985/09/21 01:37:13 18N 102W   18 7.6      66  72   1  2012/03/25 22:37:06 35S  72W   41 7.1      87  95   1  2019/01/20 01:32:51 30S  71W   53 6.7      89          1994/08/05 19:41:56 55S 128W   10 6.2     100          2010/02/27 19:54:30 11N  43W   10 5.4
 100E  97W 172W 104W  97W  72W 129W 129W      73  80   1  2014/10/07 13:49:39 23N 100E    9 6.1      72  79   1  1978/11/29 19:52:47 16N  97W   18 7.7      36  40   2  2009/09/29 17:48:10 15S 172W   18 8.1      63  69   2  1995/10/09 15:35:53 19N 104W   33 8.0      72  79   1  1978/11/29 19:52:47 16N  97W   18 7.7      80          1997/07/06 09:54:00 30S  72W   19 6.8      87          1976/12/20 20:33:11 49N 129W   20 6.7      94          2007/03/03 20:52:09 55S 129W   10 5.7
  97W  99W 176W 176W 104W 129W 132W 131W      72  79   1  1978/11/29 19:52:47 16N  97W   18 7.7      74  81   1  2009/04/27 16:46:28 17N  99W   35 5.8      44          1977/06/22 12:08:34 23S 176W   64 8.1      53          2011/07/06 19:03:17 29S 176W   20 7.6      63  69   2  1995/10/09 15:35:53 19N 104W   33 8.0      87          1976/12/20 20:33:11 49N 129W   20 6.7      88          2012/10/30 02:48:58 52N 132W   19 6.2      94          1987/03/30 03:13:40 75N 131W   10 5.3
 Table 1                                     Table 2                                                Table 3                                                Table 4                                                Table 5                                                Table 6                                                Table 7                                                Table 8                                                Table 9

 EM Signal Date: 2018/11/07  Strength: 7     EM Signal Date: 2018/11/07  Strength: 7                EM Signal Date: 2018/11/07  Strength: 7                EM Signal Date: 2018/11/07  Strength: 7                EM Signal Date: 2018/11/07  Strength: 7                EM Signal Date: 2018/11/07  Strength: 7                EM Signal Date: 2018/11/07  Strength: 7                EM Signal Date: 2018/11/07  Strength: 7                EM Signal Date: 2018/11/07  Strength: 7
 Table Longitudes                            Destructive Matches - Quality Sort                     Destructive Matches - Longitude Sort                   8.0+ Mag - Longitude Sort                              7.5+ Mag - Longitude Sort                              7.0+ Mag - Longitude Sort                              6.5+ Mag - Longitude Sort                              6.0+ Mag - Longitude Sort                              5.0+ Mag - Longitude Sort

 Qual  Lon 8.0+ 7.5+ 7.0+ 6.5+ 6.0+ 5.0+      Pa  Pd  D#  Earthquake UTC Date Lat Lon Depth Mag      Pa  Pd  D#  Earthquake UTC Date Lat Lon Depth Mag      Pa  Pd  D#  Earthquake UTC Date Lat Lon Depth Mag      Pa  Pd  D#  Earthquake UTC Date Lat Lon Dept           Pa  Pd  D#  Earthquake UTC Date Lat Lon Depth Mag      Pa  Pd  D#  Earthquake UTC Date Lat Lon Depth Mag      Pa  Pd  D#  Earthquake UTC Date Lat Lon Depth Mag      Pa  Pd  D#  Earthquake UTC Date Lat Lon Depth Mag

 124E 146E 165E 166E 179E 180E 180E 119E      82 100   2  2000/05/04 04:21:16  1S 124E   26 7.6      68  83   2  1993/10/13 02:06:00  6S 146E   25 6.9      40  49   2  2013/02/06 01:12:25 11S 165E   24 8.0      46          1980/07/17 19:42:24 12S 166E   32 7.8      75          2016/09/01 16:37:57 37S 179E   19 7.1      80          2000/08/15 04:30:08 32S 180E  357 6.6      80          2000/08/15 04:30:08 32S 180E  357 6.6      94          1998/08/22 22:58:28 16N 119E   33 5.4
 122E 139E 161E 165E 179E 179E 154E 118E      81  99   1  1977/03/18 21:43:52 17N 122E   37 7.0      77  93   1  1983/08/08 03:47:57 35N 139E   25 5.7      10          2004/12/23 14:59:04 49S 161E   10 8.1      40  49   2  2013/02/06 01:12:25 11S 165E   24 8.0      75          2016/09/01 16:37:57 37S 179E   19 7.1      75          2016/09/01 16:37:57 37S 179E   19 7.1      82          2000/08/14 22:11:16  9S 154E   10 6.0      94          2002/10/06 16:27:00  8S 118E   10 5.1
  52E 125E 155E 153E 151E 179E 153E 118E      81  98   1  1988/08/11 16:00:07 30N  52E   32 5.8      78  95   2  2004/11/11 21:26:41  8S 125E   10 7.5       9          2007/01/13 04:23:21 46N 155E   10 8.1      40          2005/09/09 07:26:43  5S 153E   90 7.7      80          2000/07/16 03:57:45  8S 151E   10 7.3      75          2016/09/01 16:37:57 37S 179E   19 7.1      82          1979/07/09 16:08:08  6S 153E   18 6.1      97          2002/10/06 16:23:28  8S 118E   10 5.0
  70W 124E 155E 149E 145E 151E 151E 116E      78  95   1  1987/08/08 15:48:56 19S  70W   70 7.2      82 100   2  2000/05/04 04:21:16  1S 124E   26 7.6       9          2007/01/13 04:23:21 46N 155E   10 8.1      46          1978/03/23 03:15:20 45N 149E   23 7.6      74          2002/04/26 16:06:06 13N 145E   85 7.1      80          2000/07/16 03:57:45  8S 151E   10 7.3      80          2000/07/16 03:57:45  8S 151E   10 7.3      94          1983/02/26 16:00:14 11S 116E   33 5.0
 125E 122E 152E 149E 125E 129E 145E 114E      78  95   2  2004/11/11 21:26:41  8S 125E   10 7.5      81  99   1  1977/03/18 21:43:52 17N 122E   37 7.0       7          2000/11/17 21:01:56  6S 152E   33 8.2      46          1978/03/23 03:14:21 44N 149E    7 7.5      78  95   2  2004/11/11 21:26:41  8S 125E   10 7.5      76          1992/09/26 22:15:57  1N 129E   27 6.5      85          2017/09/20 16:37:16 38N 145E   10 6.1     100          2004/10/14 04:09:02  9S 114E   40 5.2
  99E 121E 150E 143E 124E 125E 142E 114E      78  94   1  1995/07/11 21:46:39 22N  99E   13 6.8      72  87   1  2000/05/17 03:25:48 24N 121E   10 5.4       6          1998/03/25 03:12:25 63S 150E   10 8.8      42  51   2  2018/02/25 17:44:44  6S 143E   35 7.5      82 100   2  2000/05/04 04:21:16  1S 124E   26 7.6      78  95   2  2004/11/11 21:26:41  8S 125E   10 7.5      79          2014/08/10 03:43:17 41N 142E   41 6.0      96          2003/09/10 16:30:03 50S 114E   10 5.5
  21E  99E 145E 142E 123E 124E 140E 114E      77  94   1  1991/07/12 10:42:21 45N  21E   11 5.6      78  94   1  1995/07/11 21:46:39 22N  99E   13 6.8      29          1993/08/08 08:34:24 13N 145E   59 8.2      45  55   2  1978/06/12 08:14:26 38N 142E   44 7.7      79          1996/06/17 11:22:18  7S 123E  587 7.9      82 100   2  2000/05/04 04:21:16  1S 124E   26 7.6      83          2011/03/19 09:56:51 37N 140E   25 6.1      98          1994/06/09 16:37:46 10S 114E   33 5.8
  23E  52E 118E 125E 122E 123E 131E 113E      77  93   1  1981/03/07 11:34:44 38N  23E   33 5.5      77  93   1  1988/08/11 16:04:45 30N  52E   33 6.1      21  25   3  1977/08/19 06:08:55 11S 118E   25 8.3      78  95   2  2004/11/11 21:26:41  8S 125E   10 7.5      81  99   1  1977/03/18 21:43:52 17N 122E   37 7.0      79          1996/06/17 11:22:18  7S 123E  587 7.9      79          1998/11/18 15:48:40  3S 131E   33 6.0      96          1994/04/25 22:21:51  9S 113E   67 5.8
  52E  52E 101E 125E  91E 122E 125E 111E      77  93   1  1988/08/11 16:04:45 30N  52E   33 6.1      81  98   1  1988/08/11 16:00:07 30N  52E   32 5.8      39  47   2  2007/09/12 11:10:26  4S 101E   34 8.4      58          1984/11/20 08:15:15  5N 125E  180 7.5      80          2001/11/14 09:26:10 36N  91E   10 7.9      81  99   1  1977/03/18 21:43:52 17N 122E   37 7.0      81          1979/11/19 22:17:22  6N 125E   90 6.4      93          2010/12/21 03:59:39  9S 111E   56 5.6
 139E  50E  93E 124E  70E  99E 124E  26E      77  93   1  1983/08/08 03:47:57 35N 139E   25 5.7      74  90   2  1990/06/21 09:02:14 37N  50E   15 5.8      30  36   1  2012/04/11 08:38:36  2N  93E   20 8.6      82 100   2  2000/05/04 04:21:16  1S 124E   26 7.6      66  80   3  2015/10/26 09:09:42 37N  70E  231 7.5      78  94   1  1995/07/11 21:46:39 22N  99E   13 6.8      82 100   2  2000/05/04 04:21:16  1S 124E   26 7.6      93          2018/02/17 05:18:29 53S  26E   10 5.0
  27E  44E  68W 123E  25W  91E 123E  23E      75  91   2  1990/10/18 09:30:44 26S  27E    5 4.0      72  88   1  2005/01/25 16:44:16 38N  44E   41 5.9      16  19   1  1994/06/09 00:33:16 14S  68W  631 8.2      79          1996/06/17 11:22:18  7S 123E  587 7.9      80          1983/10/22 04:21:34 61S  25W    5 7.1      80          2001/11/14 09:26:10 36N  91E   10 7.9      79          1996/06/17 11:22:18  7S 123E  587 7.9      96          2018/01/02 04:24:17 41N  23E    6 5.1
   7E  27E  70W 113E  70W  22E 122E  23E      74  90   1  1991/02/13 15:49:38 45N   7E    5 3.8      75  91   2  1990/10/18 09:30:44 26S  27E    5 4.0      17  21   1  1995/07/30 05:11:23 23S  70W   46 8.0      53  64   3  1994/06/02 18:17:34 10S 113E   18 7.8      73  88   1  1998/01/30 12:16:08 24S  70W   42 7.1      82          1995/05/13 08:47:12 40N  22E   14 6.8      81  99   1  1977/03/18 21:43:52 17N 122E   37 7.0      95          2009/05/24 16:17:50 41N  23E    1 5.3
  50E  23E  71W 101E  70W  25W  91E  63W      74  90   2  1990/06/21 09:02:14 37N  50E   15 5.8      77  93   1  1981/03/07 11:34:44 38N  23E   33 5.5      71  86   1  2014/04/01 23:46:47 20S  71W   25 8.2      39  47   2  2007/09/12 11:10:26  4S 101E   34 8.4      78  95   1  1987/08/08 15:48:56 19S  70W   70 7.2      80          1983/10/22 04:21:34 61S  25W    5 7.1      80          2001/11/14 09:26:10 36N  91E   10 7.9      93          2015/02/04 10:59:28 11N  63W  100 5.1
  70W  21E  72W  91E  71W  70W  22E  63W      73  88   1  1998/01/30 12:16:08 24S  70W   42 7.1      77  94   1  1991/07/12 10:42:21 45N  21E   11 5.6       7   9   2  2015/09/16 22:54:32 32S  72W   22 8.3      80          2001/11/14 09:26:10 36N  91E   10 7.9      71  86   1  2014/04/01 23:46:47 20S  71W   25 8.2      78  95   1  1987/08/08 15:48:56 19S  70W   70 7.2      82          1995/05/13 08:47:12 40N  22E   14 6.8      95          1983/08/23 04:01:11 19N  63W   56 5.0
  44E  14E  72W  70E  73W  71W  25W  64W      72  88   1  2005/01/25 16:44:16 38N  44E   41 5.9      72  87   1  1998/04/12 10:55:32 46N  14E   10 5.6       7   8   3  1985/03/03 22:47:07 33S  72W   33 8.0      66  80   3  2015/10/26 09:09:42 37N  70E  231 7.5      82          1974/08/18 10:44:10 38S  73W    9 7.1      81          1998/01/12 10:14:07 31S  71W   34 6.6      80          1983/10/22 04:21:34 61S  25W    5 7.1      97          2018/03/02 04:42:15 22S  64W  525 5.4
 121E   7E  77W  71W  76W  73W  71W  67W      72  87   1  2000/05/17 03:25:48 24N 121E   10 5.4      74  90   1  1991/02/13 15:49:38 45N   7E    5 3.8      29  35   3  2007/08/15 23:40:57 13S  77W   39 8.0      71  86   1  2014/04/01 23:46:47 20S  71W   25 8.2      78          2012/09/30 16:31:35  2N  76W  170 7.3      82          1974/08/18 10:44:10 38S  73W    9 7.1      81          1998/01/12 10:14:07 31S  71W   34 6.6      92          1989/12/12 16:15:36 21S  67W  211 5.0
  14E  70W 103W  74W  98W  76W  73W  67W      72  87   1  1998/04/12 10:55:32 46N  14E   10 5.6      73  88   1  1998/01/30 12:16:08 24S  70W   42 7.1      36  43   4  1985/09/19 13:17:47 18N 103W   28 8.0      42          2016/12/25 14:22:27 43S  74W   38 7.6      67  81   1  1982/06/07 10:59:40 17N  98W   34 7.0      78          2012/09/30 16:31:35  2N  76W  170 7.3      82          1974/08/18 10:44:10 38S  73W    9 7.1      92          1974/11/29 22:27:29 28S  67W  143 5.5
 101W  70W 172W  76W 101W 113W 115W  68W      72  87   2  1979/03/14 11:07:16 18N 101W   49 7.6      78  95   1  1987/08/08 15:48:56 19S  70W   70 7.2      26  32   2  2009/09/29 17:48:10 15S 172W   18 8.1      58  70   2  1996/11/12 16:59:44 15S  76W   33 7.7      72  87   2  1979/03/14 11:07:16 18N 101W   49 7.6      77          1975/07/08 09:37:24 29N 113W    2 6.5      79          2003/08/28 04:48:19 50S 115W   10 6.2      92          1992/10/26 22:44:13 21S  68W  146 5.0
  71W  71W 174W 101W 124W 124W 124W  69W      71  86   1  2014/04/01 23:46:47 20S  71W   25 8.2      71  86   1  2014/04/01 23:46:47 20S  71W   25 8.2      32          2006/05/03 15:26:40 20S 174W   55 8.0      72  87   2  1979/03/14 11:07:16 18N 101W   49 7.6      85          1980/11/08 10:27:35 41N 124W   17 7.3      85          1980/11/08 10:27:35 41N 124W   17 7.3      85          1980/11/08 10:27:35 41N 124W   17 7.3      93          1990/02/25 22:51:09 18S  69W  141 5.5
 146E 101W 174W 103W 153W 153W 142W  70W      68  83   2  1993/10/13 02:06:00  6S 146E   25 6.9      72  87   2  1979/03/14 11:07:16 18N 101W   49 7.6      29          1995/04/07 22:06:56 15S 174W   21 8.1      36  43   4  1985/09/19 13:17:47 18N 103W   28 8.0      75          2016/01/24 10:30:30 60N 153W  128 7.1      75          2016/01/24 10:30:30 60N 153W  128 7.1      80          1984/01/02 22:09:58 57S 142W    1 6.4      93          2008/03/07 22:35:00 17S  70W   82 5.1
Table 1A Table 2A Table 3 Table 4 Table 5 Table 6 Table 7 Table 8 Table 9 EM Signal Date: 2018/11/07 Strength: 7 EM Signal Date: 2018/11/07 Strength: 7 EM Signal Date: 2018/11/07 Strength: 7 EM Signal Date: 2018/11/07 Strength: 7 EM Signal Date: 2018/11/07 Strength: 7 EM Signal Date: 2018/11/07 Strength: 7 EM Signal Date: 2018/11/07 Strength: 7 EM Signal Date: 2018/11/07 Strength: 7 EM Signal Date: 2018/11/07 Strength: 7The 21 bold longitude entries in Table 1A shown above for the 2018/11/07 EM 7 Signal
Table Longitudes Summary Destructive Matches - Quality Sort Destructive Matches - Longitude Sort 8.0+ Mag - Longitude Sort 7.5+ Mag - Longitude Sort 7.0+ Mag - Longitude Sort 6.5+ Mag - Longitude Sort 6.0+ Mag - Longitude Sort 5.0+ Mag - Longitude Sort Qual Lon 8.0+ 7.5+ 7.0+ 6.5+ 6.0+ 5.0+ Pa Pd D# Earthquake UTC Date Lat Lon Depth Mag Pa Pd D# Earthquake UTC Date Lat Lon Depth Mag Pa Pd D# Earthquake UTC Date Lat Lon Depth Mag Pa Pd D# Earthquake UTC Date Lat Lon Depth Mag Pa Pd D# Earthquake UTC Date Lat Lon Depth Mag Pa Pd D# Earthquake UTC Date Lat Lon Depth Mag Pa Pd D# Earthquake UTC Date Lat Lon Depth Mag Pa Pd D# Earthquake UTC Date Lat Lon Depth Mag
124E 146E 165E 166E 179E 180E 180E 119E 82 100 2 2000/05/04 04:21:16 1S 124E 26 7.6 68 83 2 1993/10/13 02:06:00 6S 146E 25 6.9 40 49 2 2013/02/06 01:12:25 11S 165E 24 8.0 46 1980/07/17 19:42:24 12S 166E 32 7.8 75 2016/09/01 16:37:57 37S 179E 19 7.1 80 2000/08/15 04:30:08 32S 180E 357 6.6 80 2000/08/15 04:30:08 32S 180E 357 6.6 94 1998/08/22 22:58:28 16N 119E 33 5.4 122E 139E 161E 165E 179E 179E 154E 118E 81 99 1 1977/03/18 21:43:52 17N 122E 37 7.0 77 93 1 1983/08/08 03:47:57 35N 139E 25 5.7 10 2004/12/23 14:59:04 49S 161E 10 8.1 40 49 2 2013/02/06 01:12:25 11S 165E 24 8.0 75 2016/09/01 16:37:57 37S 179E 19 7.1 75 2016/09/01 16:37:57 37S 179E 19 7.1 82 2000/08/14 22:11:16 9S 154E 10 6.0 94 2002/10/06 16:27:00 8S 118E 10 5.1 52E 125E 155E 153E 151E 179E 153E 118E 81 98 1 1988/08/11 16:00:07 30N 52E 32 5.8 78 95 2 2004/11/11 21:26:41 8S 125E 10 7.5 9 2007/01/13 04:23:21 46N 155E 10 8.1 40 2005/09/09 07:26:43 5S 153E 90 7.7 80 2000/07/16 03:57:45 8S 151E 10 7.3 75 2016/09/01 16:37:57 37S 179E 19 7.1 82 1979/07/09 16:08:08 6S 153E 18 6.1 97 2002/10/06 16:23:28 8S 118E 10 5.0 70W 124E 155E 149E 145E 151E 151E 116E 78 95 1 1987/08/08 15:48:56 19S 70W 70 7.2 82 100 2 2000/05/04 04:21:16 1S 124E 26 7.6 9 2007/01/13 04:23:21 46N 155E 10 8.1 46 1978/03/23 03:15:20 45N 149E 23 7.6 74 2002/04/26 16:06:06 13N 145E 85 7.1 80 2000/07/16 03:57:45 8S 151E 10 7.3 80 2000/07/16 03:57:45 8S 151E 10 7.3 94 1983/02/26 16:00:14 11S 116E 33 5.0 125E 122E 152E 149E 125E 129E 145E 114E 78 95 2 2004/11/11 21:26:41 8S 125E 10 7.5 81 99 1 1977/03/18 21:43:52 17N 122E 37 7.0 7 2000/11/17 21:01:56 6S 152E 33 8.2 46 1978/03/23 03:14:21 44N 149E 7 7.5 78 95 2 2004/11/11 21:26:41 8S 125E 10 7.5 76 1992/09/26 22:15:57 1N 129E 27 6.5 85 2017/09/20 16:37:16 38N 145E 10 6.1 100 2004/10/14 04:09:02 9S 114E 40 5.2 99E 121E 150E 143E 124E 125E 142E 114E 78 94 1 1995/07/11 21:46:39 22N 99E 13 6.8 72 87 1 2000/05/17 03:25:48 24N 121E 10 5.4 6 1998/03/25 03:12:25 63S 150E 10 8.8 42 51 2 2018/02/25 17:44:44 6S 143E 35 7.5 82 100 2 2000/05/04 04:21:16 1S 124E 26 7.6 78 95 2 2004/11/11 21:26:41 8S 125E 10 7.5 79 2014/08/10 03:43:17 41N 142E 41 6.0 96 2003/09/10 16:30:03 50S 114E 10 5.5 21E 99E 145E 142E 123E 124E 140E 114E 77 94 1 1991/07/12 10:42:21 45N 21E 11 5.6 78 94 1 1995/07/11 21:46:39 22N 99E 13 6.8 29 1993/08/08 08:34:24 13N 145E 59 8.2 45 55 2 1978/06/12 08:14:26 38N 142E 44 7.7 79 1996/06/17 11:22:18 7S 123E 587 7.9 82 100 2 2000/05/04 04:21:16 1S 124E 26 7.6 83 2011/03/19 09:56:51 37N 140E 25 6.1 98 1994/06/09 16:37:46 10S 114E 33 5.8 23E 52E 118E 125E 122E 123E 131E 113E 77 93 1 1981/03/07 11:34:44 38N 23E 33 5.5 77 93 1 1988/08/11 16:04:45 30N 52E 33 6.1 21 25 3 1977/08/19 06:08:55 11S 118E 25 8.3 78 95 2 2004/11/11 21:26:41 8S 125E 10 7.5 81 99 1 1977/03/18 21:43:52 17N 122E 37 7.0 79 1996/06/17 11:22:18 7S 123E 587 7.9 79 1998/11/18 15:48:40 3S 131E 33 6.0 96 1994/04/25 22:21:51 9S 113E 67 5.8 52E 52E 101E 125E 91E 122E 125E 111E 77 93 1 1988/08/11 16:04:45 30N 52E 33 6.1 81 98 1 1988/08/11 16:00:07 30N 52E 32 5.8 39 47 2 2007/09/12 11:10:26 4S 101E 34 8.4 58 1984/11/20 08:15:15 5N 125E 180 7.5 80 2001/11/14 09:26:10 36N 91E 10 7.9 81 99 1 1977/03/18 21:43:52 17N 122E 37 7.0 81 1979/11/19 22:17:22 6N 125E 90 6.4 93 2010/12/21 03:59:39 9S 111E 56 5.6 139E 50E 93E 124E 70E 99E 124E 26E 77 93 1 1983/08/08 03:47:57 35N 139E 25 5.7 74 90 2 1990/06/21 09:02:14 37N 50E 15 5.8 30 36 1 2012/04/11 08:38:36 2N 93E 20 8.6 82 100 2 2000/05/04 04:21:16 1S 124E 26 7.6 66 80 3 2015/10/26 09:09:42 37N 70E 231 7.5 78 94 1 1995/07/11 21:46:39 22N 99E 13 6.8 82 100 2 2000/05/04 04:21:16 1S 124E 26 7.6 93 2018/02/17 05:18:29 53S 26E 10 5.0 27E 44E 68W 123E 25W 91E 123E 23E 75 91 2 1990/10/18 09:30:44 26S 27E 5 4.0 72 88 1 2005/01/25 16:44:16 38N 44E 41 5.9 16 19 1 1994/06/09 00:33:16 14S 68W 631 8.2 79 1996/06/17 11:22:18 7S 123E 587 7.9 80 1983/10/22 04:21:34 61S 25W 5 7.1 80 2001/11/14 09:26:10 36N 91E 10 7.9 79 1996/06/17 11:22:18 7S 123E 587 7.9 96 2018/01/02 04:24:17 41N 23E 6 5.1 7E 27E 70W 113E 70W 22E 122E 23E 74 90 1 1991/02/13 15:49:38 45N 7E 5 3.8 75 91 2 1990/10/18 09:30:44 26S 27E 5 4.0 17 21 1 1995/07/30 05:11:23 23S 70W 46 8.0 53 64 3 1994/06/02 18:17:34 10S 113E 18 7.8 73 88 1 1998/01/30 12:16:08 24S 70W 42 7.1 82 1995/05/13 08:47:12 40N 22E 14 6.8 81 99 1 1977/03/18 21:43:52 17N 122E 37 7.0 95 2009/05/24 16:17:50 41N 23E 1 5.3 50E 23E 71W 101E 70W 25W 91E 63W 74 90 2 1990/06/21 09:02:14 37N 50E 15 5.8 77 93 1 1981/03/07 11:34:44 38N 23E 33 5.5 71 86 1 2014/04/01 23:46:47 20S 71W 25 8.2 39 47 2 2007/09/12 11:10:26 4S 101E 34 8.4 78 95 1 1987/08/08 15:48:56 19S 70W 70 7.2 80 1983/10/22 04:21:34 61S 25W 5 7.1 80 2001/11/14 09:26:10 36N 91E 10 7.9 93 2015/02/04 10:59:28 11N 63W 100 5.1 70W 21E 72W 91E 71W 70W 22E 63W 73 88 1 1998/01/30 12:16:08 24S 70W 42 7.1 77 94 1 1991/07/12 10:42:21 45N 21E 11 5.6 7 9 2 2015/09/16 22:54:32 32S 72W 22 8.3 80 2001/11/14 09:26:10 36N 91E 10 7.9 71 86 1 2014/04/01 23:46:47 20S 71W 25 8.2 78 95 1 1987/08/08 15:48:56 19S 70W 70 7.2 82 1995/05/13 08:47:12 40N 22E 14 6.8 95 1983/08/23 04:01:11 19N 63W 56 5.0 44E 14E 72W 70E 73W 71W 25W 64W 72 88 1 2005/01/25 16:44:16 38N 44E 41 5.9 72 87 1 1998/04/12 10:55:32 46N 14E 10 5.6 7 8 3 1985/03/03 22:47:07 33S 72W 33 8.0 66 80 3 2015/10/26 09:09:42 37N 70E 231 7.5 82 1974/08/18 10:44:10 38S 73W 9 7.1 81 1998/01/12 10:14:07 31S 71W 34 6.6 80 1983/10/22 04:21:34 61S 25W 5 7.1 97 2018/03/02 04:42:15 22S 64W 525 5.4 121E 7E 77W 71W 76W 73W 71W 67W 72 87 1 2000/05/17 03:25:48 24N 121E 10 5.4 74 90 1 1991/02/13 15:49:38 45N 7E 5 3.8 29 35 3 2007/08/15 23:40:57 13S 77W 39 8.0 71 86 1 2014/04/01 23:46:47 20S 71W 25 8.2 78 2012/09/30 16:31:35 2N 76W 170 7.3 82 1974/08/18 10:44:10 38S 73W 9 7.1 81 1998/01/12 10:14:07 31S 71W 34 6.6 92 1989/12/12 16:15:36 21S 67W 211 5.0 14E 70W 103W 74W 98W 76W 73W 67W 72 87 1 1998/04/12 10:55:32 46N 14E 10 5.6 73 88 1 1998/01/30 12:16:08 24S 70W 42 7.1 36 43 4 1985/09/19 13:17:47 18N 103W 28 8.0 42 2016/12/25 14:22:27 43S 74W 38 7.6 67 81 1 1982/06/07 10:59:40 17N 98W 34 7.0 78 2012/09/30 16:31:35 2N 76W 170 7.3 82 1974/08/18 10:44:10 38S 73W 9 7.1 92 1974/11/29 22:27:29 28S 67W 143 5.5 101W 70W 172W 76W 101W 113W 115W 68W 72 87 2 1979/03/14 11:07:16 18N 101W 49 7.6 78 95 1 1987/08/08 15:48:56 19S 70W 70 7.2 26 32 2 2009/09/29 17:48:10 15S 172W 18 8.1 58 70 2 1996/11/12 16:59:44 15S 76W 33 7.7 72 87 2 1979/03/14 11:07:16 18N 101W 49 7.6 77 1975/07/08 09:37:24 29N 113W 2 6.5 79 2003/08/28 04:48:19 50S 115W 10 6.2 92 1992/10/26 22:44:13 21S 68W 146 5.0 71W 71W 174W 101W 124W 124W 124W 69W 71 86 1 2014/04/01 23:46:47 20S 71W 25 8.2 71 86 1 2014/04/01 23:46:47 20S 71W 25 8.2 32 2006/05/03 15:26:40 20S 174W 55 8.0 72 87 2 1979/03/14 11:07:16 18N 101W 49 7.6 85 1980/11/08 10:27:35 41N 124W 17 7.3 85 1980/11/08 10:27:35 41N 124W 17 7.3 85 1980/11/08 10:27:35 41N 124W 17 7.3 93 1990/02/25 22:51:09 18S 69W 141 5.5 146E 101W 174W 103W 153W 153W 142W 70W 68 83 2 1993/10/13 02:06:00 6S 146E 25 6.9 72 87 2 1979/03/14 11:07:16 18N 101W 49 7.6 29 1995/04/07 22:06:56 15S 174W 21 8.1 36 43 4 1985/09/19 13:17:47 18N 103W 28 8.0 75 2016/01/24 10:30:30 60N 153W 128 7.1 75 2016/01/24 10:30:30 60N 153W 128 7.1 80 1984/01/02 22:09:58 57S 142W 1 6.4 93 2008/03/07 22:35:00 17S 70W 82 5.1
 Table 1B                                    Table 2B                                               Table 3                                                Table 4                                                Table 5                                                Table 6                                                Table 7                                                Table 8                                                Table 9

 EM Signal Date: 2018/10/23  Strength: 7     EM Signal Date: 2018/10/23  Strength: 7                EM Signal Date: 2018/10/23  Strength: 7                EM Signal Date: 2018/10/23  Strength: 7                EM Signal Date: 2018/10/23  Strength: 7                EM Signal Date: 2018/10/23  Strength: 7                EM Signal Date: 2018/10/23  Strength: 7                EM Signal Date: 2018/10/23  Strength: 7                EM Signal Date: 2018/10/23  Strength: 7
 Table Longitudes                            Destructive Matches - Quality Sort                     Destructive Matches - Longitude Sort                   8.0+ Mag - Longitude Sort                              7.5+ Mag - Longitude Sort                              7.0+ Mag - Longitude Sort                              6.5+ Mag - Longitude Sort                              6.0+ Mag - Longitude Sort                              5.0+ Mag - Longitude Sort

 Qual  Lon 8.0+ 7.5+ 7.0+ 6.5+ 6.0+ 5.0+      Pa  Pd  D#  Earthquake UTC Date Lat Lon Depth Mag      Pa  Pd  D#  Earthquake UTC Date Lat Lon Depth Mag      Pa  Pd  D#  Earthquake UTC Date Lat Lon Depth Mag      Pa  Pd  D#  Earthquake UTC Date Lat Lon Dept           Pa  Pd  D#  Earthquake UTC Date Lat Lon Depth Mag      Pa  Pd  D#  Earthquake UTC Date Lat Lon Depth Mag      Pa  Pd  D#  Earthquake UTC Date Lat Lon Depth Mag      Pa  Pd  D#  Earthquake UTC Date Lat Lon Depth Mag

  98W 139E 165E 179E 170E 171E 174E 174E      97 100   3  2017/09/19 18:14:38 19N  98W   48 7.1      73  76   3  1989/08/01 00:18:04  5S 139E   14 6.3      12  13   2  2013/02/06 01:12:25 11S 165E   24 8.0      52          2018/09/06 15:49:18 18S 179E  671 7.9      59          2003/12/27 16:01:00 22S 170E   10 7.3      91          1981/11/24 23:30:34 22S 171E   31 6.7      84          1977/01/18 05:41:49 42S 174E   41 6.0      95          2016/11/13 23:49:10 42S 174E   10 5.2
 101E 104E 161E 170E 167E 169E 171E 174E      82  85   2  1976/11/06 18:04:08 28N 101E   33 6.5      78  80   2  2013/07/21 23:45:56 35N 104E    8 5.9      36          2004/12/23 14:59:04 49S 161E   10 8.1      47          1995/05/16 20:12:44 23S 170E   20 7.8      61          1974/01/10 08:51:17 15S 167E   54 7.1      80          2007/09/28 01:35:52 21S 169E   10 6.6      91          1981/11/24 23:30:34 22S 171E   31 6.7      93          2016/11/13 11:12:39 42S 174E   10 5.8
  87E 101E 153E 166E 156E 169E 170E 174E      80  83   1  2016/11/27 23:35:21 28N  87E   10 5.4      82  85   2  1976/11/06 18:04:08 28N 101E   33 6.5      62          2013/05/24 05:44:49 55N 153E  608 8.3      47          2009/10/07 22:18:26 13S 166E   35 7.7      59          1977/07/29 11:15:42  8S 156E    2 7.2      74          2003/12/25 20:42:33 22S 169E   10 6.5      87          2018/09/10 19:31:37 22S 170E   12 6.3      99          1986/02/24 00:19:43 17S 174E   12 5.8
  50E  95E 153E 166E 153E 166E 168E 172E      79  82   2  2000/11/25 18:10:47 40N  50E   33 6.5      73  75   1  1975/07/08 12:04:42 21N  95E  157 6.5      62          2013/05/24 05:44:48 55N 153E  598 8.3      42          2009/10/07 22:03:16 13S 166E   35 7.8      62          2013/05/24 05:44:49 55N 153E  608 8.3      77          2013/02/08 11:12:13 11S 166E   18 6.8      85          2015/02/19 13:18:32 16S 168E   10 6.4      99          2006/09/22 12:27:34 22S 172E  125 5.2
  78W  87E 152E 154E 153E 162E 168E 171E      78  81   2  1983/04/12 12:07:54  5S  78W  104 7.0      80  83   1  2016/11/27 23:35:21 28N  87E   10 5.4      18  19   1  2000/11/16 04:54:56  4S 152E   33 8.0      49          1983/03/18 09:05:51  5S 154E   91 7.7      62          2013/05/24 05:44:48 55N 153E  598 8.3      80          2004/11/11 17:34:54 11S 162E   27 6.7      87          1979/01/27 18:15:02 19S 168E   30 6.2      99          2016/01/24 00:34:05 23S 171E   29 5.1
 104E  75E 137E 153E 153E 137E 167E 171E      78  80   2  2013/07/21 23:45:56 35N 104E    8 5.9      67  69   2  2002/11/01 22:09:29 36N  75E   33 5.4      19  19   3  1996/02/17 05:59:30  1S 137E   33 8.2      62          2013/05/24 05:44:49 55N 153E  608 8.3      62          2008/07/05 02:12:04 54N 153E  635 7.7      80          1974/02/22 00:36:55 33N 137E  389 6.6      85          1980/12/08 19:13:47 15S 167E   38 6.0      96          1976/03/29 18:00:24 22S 171E  104 5.0
  91W  69E  97E 153E 152E 133E 162E 170E      76  78   1  1978/02/22 06:07:37 14N  91W  100 5.7      70  72   3  1982/12/16 00:40:48 36N  69E   36 6.6      13  14   4  2005/03/28 16:09:36  2N  97E   30 8.6      62          2013/05/24 05:44:48 55N 153E  598 8.3      67          1999/05/16 00:51:20  5S 152E   73 7.1      79          2001/03/24 06:27:52 34N 133E   33 6.5      80          2004/11/11 17:33:07 11S 162E   10 6.0      96          2018/12/08 07:07:34 22S 170E   36 5.1
  52E  52E  97E 153E 139E 126E 137E 170E      75  78   2  2013/04/09 11:52:49 28N  52E   12 6.4      75  78   2  2013/04/09 11:52:49 28N  52E   12 6.4      36          2000/06/18 14:44:13 14S  97E   10 8.0      62          2008/07/05 02:12:04 54N 153E  635 7.7      58          2000/07/30 12:25:45 34N 139E   10 7.1      80          2001/02/24 07:23:48  1N 126E   35 7.1      80          1974/02/22 00:36:55 33N 137E  389 6.6      96          2018/12/06 18:07:29 23S 170E   10 5.0
  45E  50E  92E 152E 126E 124E 122E 170E      75  77   1  1989/08/03 07:42:40 44N  45E   18 5.2      79  82   2  2000/11/25 18:10:47 40N  50E   33 6.5      29          2012/04/11 10:43:10  1N  92E   25 8.2      51          2015/05/05 01:44:05  5S 152E   42 7.5      80          2001/02/24 07:23:48  1N 126E   35 7.1      79          1982/01/24 06:08:58 14N 124E   39 6.6      84          1998/09/21 06:52:41  0N 122E  147 6.1      98          2012/04/21 12:36:11 22S 170E   43 5.2
  40E  45E  92E 128E  21W 101E 122E 170E      73  76   3  2003/05/01 00:27:04 39N  40E   10 6.4      75  77   1  1989/08/03 07:42:40 44N  45E   18 5.2      29          2012/04/11 10:43:10  1N  92E   25 8.2      58          2006/01/27 16:58:49  5S 128E  346 7.6      63          1982/05/07 05:38:36 61S  21W   11 7.0      82  85   2  1976/11/06 18:04:08 28N 101E   33 6.5      84          1980/03/31 12:41:47 16N 122E   29 6.3      98          1998/06/10 00:22:08 23S 170E   33 5.3
 139E  40E  68W 127E  32W  95E 101E 170E      73  76   3  1989/08/01 00:18:04  5S 139E   14 6.3      73  76   3  2003/05/01 00:27:04 39N  40E   10 6.4      71  73   1  1994/06/09 00:33:16 14S  68W  631 8.2      43  45   1  2012/08/31 12:47:33 11N 127E   28 7.6      63          2016/08/19 07:32:22 55S  32W   10 7.4      73  75   1  1975/07/08 12:04:42 21N  95E  157 6.5      82  85   2  1976/11/06 18:04:08 28N 101E   33 6.5      93          1976/01/16 05:41:53 22S 170E   54 5.2
  95E  27E  72W 125E  68W  54E  82E 169E      73  75   1  1975/07/08 12:04:42 21N  95E  157 6.5      67  69   1  2017/07/20 22:31:11 37N  27E    7 6.6       9  10   3  1985/03/03 22:47:07 33S  72W   33 8.0      44  45   2  1998/11/29 14:10:31  2S 125E   33 7.7      71  73   1  1994/06/09 00:33:16 14S  68W  631 8.2      78          1973/10/27 06:59:57 71N  54E    0 6.9      92          1982/01/23 17:48:02 32N  82E   24 6.0      94          1989/05/20 05:59:37 20S 169E   33 5.5
   7W   7W  74W 124E  71W  50E  82E 169E      72  74   1  1997/05/21 23:50:43 43N   7W   19 5.4      72  74   1  1997/05/21 23:50:43 43N   7W   19 5.4      62  64   3  2001/06/23 20:33:14 16S  74W   33 8.4      47          2010/07/23 22:51:12  6N 124E  576 7.6      73          1989/05/05 18:28:40  8S  71W  593 7.1      79  82   2  2000/11/25 18:10:47 40N  50E   33 6.5      85          1982/01/23 17:37:28 32N  82E   10 6.3      96          1977/05/18 06:43:21 19S 169E  217 5.2
  68W   7W  75W 120E  74W  71W  22E  82E      71  73   1  1994/06/09 00:33:16 14S  68W  631 8.2      67  69   2  1997/05/21 23:49:43 43N   7W   19 5.3      31          2019/05/26 07:41:15  6S  75W  123 8.0      42  43   4  2018/09/28 10:02:43  0N 120E   10 7.5      62  64   3  2001/06/23 20:33:14 16S  74W   33 8.4      73          1989/05/05 18:28:40  8S  71W  593 7.1      86          2008/02/20 18:27:06 36N  22E    9 6.1      94          2008/03/20 23:50:07 35N  82E   10 5.1
  97W  68W  94W  85E  78W  78W  14W  77E      70  73   2  1999/06/15 20:42:05 18N  97W   70 7.0      71  73   1  1994/06/09 00:33:16 14S  68W  631 8.2      14  14   2  2017/09/08 04:49:19 15N  94W   47 8.2      49  51   4  2015/04/25 06:11:25 28N  85E    8 7.8      78  81   2  1983/04/12 12:07:54  5S  78W  104 7.0      78  81   2  1983/04/12 12:07:54  5S  78W  104 7.0      82          1990/08/05 17:42:32  1S  14W   10 6.3      93          1993/10/29 23:45:07 17N  77E   10 5.0
  69E  78W 103W  68W  83W  86W  95W   7W      70  72   3  1982/12/16 00:40:48 36N  69E   36 6.6      66  68   1  1986/01/11 19:42:21 10S  78W   39 5.1      13  14   4  1985/09/19 13:17:47 18N 103W   28 8.0      71  73   1  1994/06/09 00:33:16 14S  68W  631 8.2      66          1999/03/31 05:54:42  6N  83W   10 7.0      74          1976/03/29 05:39:35  4N  86W   21 6.6      87          1993/09/30 18:27:50 15N  95W   19 6.5      96          1997/05/22 00:17:17 43N   7W   16 5.2
  27E  78W 104W  70W  97W  95W  98W   8W      67  69   1  2017/07/20 22:31:11 37N  27E    7 6.6      78  81   2  1983/04/12 12:07:54  5S  78W  104 7.0      11  12   2  1995/10/09 15:35:53 19N 104W   33 8.0      51          2014/04/03 02:43:17 20S  70W   40 7.6      70  73   2  1999/06/15 20:42:05 18N  97W   70 7.0      87          1993/09/30 18:27:50 15N  95W   19 6.5      97 100   3  2017/09/19 18:14:38 19N  98W   48 7.1      95          1985/01/06 12:06:40 71N   8W   10 5.0
   7W  91W 174W  74W  98W  98W 103W  12W      67  69   2  1997/05/21 23:49:43 43N   7W   19 5.3      76  78   1  1978/02/22 06:07:37 14N  91W  100 5.7       7          2006/05/03 15:26:40 20S 174W   55 8.0      62  64   3  2001/06/23 20:33:14 16S  74W   33 8.4      97 100   3  2017/09/19 18:14:38 19N  98W   48 7.1      97 100   3  2017/09/19 18:14:38 19N  98W   48 7.1      80          1991/06/11 05:26:31  8N 103W   10 6.0      97          2004/04/04 18:04:34  3S  12W   10 5.4
  75E  97W 174W  89W 172W  98W 178W  95W      67  69   2  2002/11/01 22:09:29 36N  75E   33 5.4      70  73   2  1999/06/15 20:42:05 18N  97W   70 7.0       7          1995/04/07 22:06:56 15S 174W   21 8.1      54  56   5  1976/02/04 09:01:43 15N  89W    5 7.5      63          1988/10/08 04:46:26 19S 172W   41 7.1      73          1982/06/07 06:52:33 16N  98W    8 6.9      81          1999/07/28 00:16:57 29S 178W   33 6.1      95          2012/08/31 18:37:45  3N  95W   10 5.0
  78W  98W 178W 178W 179W 137W 179W  98W      66  68   1  1986/01/11 19:42:21 10S  78W   39 5.1      97 100   3  2017/09/19 18:14:38 19N  98W   48 7.1      19          2018/08/19 00:19:37 18S 178W  563 8.2      54          1994/03/09 23:28:06 18S 178W  562 7.6      60          1998/03/29 19:48:16 18S 179W  537 7.2      74          1973/07/01 13:33:32 58N 137W   12 6.7      80          2015/06/16 06:17:00 20S 179W  653 6.0      97 100   3  2017/09/19 18:14:38 19N  98W   48 7.1
As stated above, there are 21 bold 71 W area table entries in the 2018/11/07 1A EM Signal Table.
THE ABSOLUTELY CATASTROPHIC JANUARY 12, 2010 HAITI EARTHQUAKE
2010/01/12 21:53:10 18.44N 72.57W 13 7.0 "Haiti region"
The data line shape for the Haiti earthquake can be seen just below the data line for the EM 8 Signal.
Those two data lines are quite similar in shape.
That indicates that the EM Signal was likely associated with the
approach of the following day's Haiti earthquake. And as can be seen, one of the
main line peaks for the EM Signal data line was located right around 73 W
where the earthquake eventually occurred.
That especially high intensity EM Signal data line was likely accurately indicating that a Significant Earthquake might be about to occur in some fault zone along the 73 W longitude line.
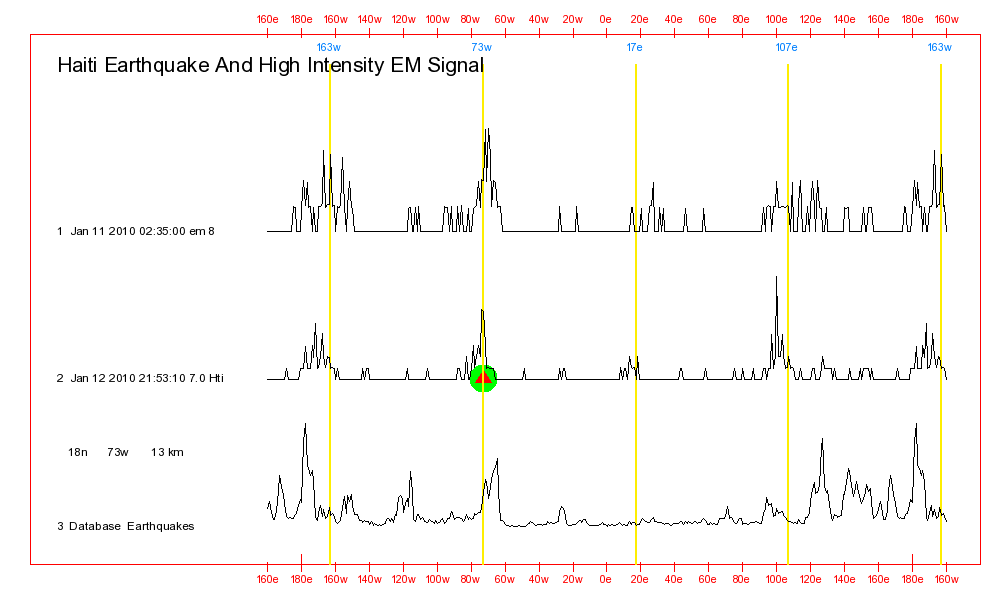
Table 1                                      Table 2                                                Table 3                                                Table 4                                                Table 5                                                Table 6                                                Table 7                                                Table 8                                                Table 9

EM Signal Date:  2010/01/11                  EM Signal Date:  2010/01/11                            EM Signal Date:  2010/01/11                            EM Signal Date:  2010/01/11                            EM Signal Date:  2010/01/11                            EM Signal Date:  2010/01/11                            EM Signal Date:  2010/01/11                            EM Signal Date:  2010/01/11                            EM Signal Date:  2010/01/11
Strength:        8                           Strength:        8                                     Strength:        8                                     Strength:        8                                     Strength:        8                                     Strength:        8                                     Strength:        8                                     Strength:        8                                     Strength:        8

Table Longitudes from tables 2 through 9                  Destructive Matches - Quality Sort                     Destructive Matches - Longitude Sort                   8.0+ Mag - Longitude Sort                              7.5+ Mag - Longitude Sort                              7.0+ Mag - Longitude Sort                              6.5+ Mag - Longitude Sort                              6.0+ Mag - Longitude Sort                              5.0+ Mag - Longitude Sort

 Qual  Lon 8.0+ 7.5+ 7.0+ 6.5+ 6.0+ 5.0+     Pa  Pd  D#   Earthquake UTC Date Lat Lon Depth Mag     Pa  Pd  D#   Earthquake UTC Date Lat Lon Depth Mag     Pa  Pd  D#   Earthquake UTC Date Lat Lon Depth Mag     Pa  Pd  D#   Earthquake UTC Date Lat Lon Depth Mag     Pa  Pd  D#   Earthquake UTC Date Lat Lon Depth Mag     Pa  Pd  D#   Earthquake UTC Date Lat Lon Depth Mag     Pa  Pd  D#   Earthquake UTC Date Lat Lon Depth Mag     Pa  Pd  D#   Earthquake UTC Date Lat Lon Depth Mag
  77W 140E 165E 179E 179E 179E 179E 124E      84 100   1  1993/04/18 09:16:23 12S  77W  106 6.3      71  85   1  1987/12/17 02:08:19 35N 140E   63 6.7      24  28   2  2013/02/06 01:12:25 11S 165E   24 8.0      80          2014/06/23 20:53:09 52N 179E  107 7.9      80          2014/06/23 20:53:09 52N 179E  107 7.9      80          2014/06/23 20:53:09 52N 179E  107 7.9      80          2014/06/23 20:53:09 52N 179E  107 7.9      90          2002/02/08 09:01:47 12S 124E   33 5.1
  73W 126E 161E 154E 166E 156E 156E 114E      82  99   1  1994/03/02 03:38:03 20N  73W   59 5.4      73  88   1  1975/10/31 08:28:02 13N 126E   50 7.2      29          2004/12/23 14:59:04 49S 161E   10 8.1      60          1995/08/16 10:27:28  6S 154E   30 7.8      73          2013/02/06 01:54:15 10S 166E   10 7.0      75          1974/05/15 18:59:57 50N 156E   58 6.5      85          2006/08/20 03:01:02 50N 156E   26 6.0      92          1994/06/03 13:39:24  9S 114E   33 5.4
  73W 104E 150E 150E 154E 145E 123E 113E      80  96   6  2010/01/12 21:53:10 18N  73W   13 7.0      77  92   2  1976/08/23 03:30:07 32N 104E   33 6.7      72          1998/03/25 03:12:25 63S 150E   10 8.8      72          1998/03/25 03:12:25 63S 150E   10 8.8      71          2008/11/24 09:02:58 54N 154E  492 7.3      74          2012/08/14 02:59:42 50N 145E  625 7.7      80          1985/08/04 02:36:23  7N 123E   22 6.4      99          2001/01/19 20:26:41  9S 113E  112 5.2
  69E 101E 150E 150E 150E 130E 120E 106E      78  93   2  1999/02/11 14:08:51 34N  69E   33 6.0      68  81   3  1981/01/23 21:13:51 31N 101E   33 6.8      72          1998/03/25 03:12:25 63S 150E   10 8.1      72          1998/03/25 03:12:25 63S 150E   10 8.1      72          1998/03/25 03:12:25 63S 150E   10 8.8      77          1992/12/20 20:52:47  7S 130E   77 7.0      84          1996/02/07 07:57:18  1N 120E   13 6.1      93          2019/07/28 14:25:02  7S 106E   53 5.1
  71W 101E 101E 145E 150E 104E 100E 104E      78  93   1  1987/08/13 15:23:06 18S  71W   37 6.6      75  90   2  1979/03/15 12:52:29 23N 101E   33 6.2      60  72   2  2007/09/12 11:10:26  4S 101E   34 8.4      74          2012/08/14 02:59:42 50N 145E  625 7.7      72          1998/03/25 03:12:25 63S 150E   10 8.1      77  92   2  1976/08/23 03:30:07 32N 104E   33 6.7      82          2008/03/03 02:37:27  2S 100E   25 6.1      89          1974/06/15 07:15:54 28N 104E   33 5.1
  27E  95E  93E 136E 145E  98E  98E  95E      77  92   1  1988/01/05 06:41:16 27S  27E    5 5.2      76  91   1  2006/12/17 21:10:21  5N  95E   36 5.8      22  26   1  2012/04/11 08:38:36  2N  93E   20 8.6      51  61   2  1979/09/12 05:17:51  2S 136E    5 7.9      74          2012/08/14 02:59:42 50N 145E  625 7.7      79          1984/11/17 06:49:30  0N  98E   28 7.1      79          1984/11/17 06:49:30  0N  98E   28 7.1      91          2016/10/26 02:21:59 23N  95E  110 5.0
 104E  95E  92E 101E 143E  95E  20E  26E      77  92   2  1976/08/23 03:30:07 32N 104E   33 6.7      74  88   2  1988/08/06 00:36:24 25N  95E   91 7.3      50          2012/04/11 10:43:10  1N  92E   25 8.2      58          2007/09/12 23:49:04  3S 101E   30 7.9      68          1992/07/18 08:36:58 39N 143E   28 7.0      74  88   2  1988/08/06 00:36:24 25N  95E   91 7.3      83          2014/01/26 13:55:42 38N  20E    8 6.1      91          1981/12/21 14:15:43 39N  26E   15 5.0
  95E  92E  92E 101E 130E  63E  64W  64W      76  91   1  2006/12/17 21:10:21  5N  95E   36 5.8      67  80   1  1988/02/06 14:50:45 25N  92E   33 5.9      50          2012/04/11 10:43:10  1N  92E   25 8.2      60  72   2  2007/09/12 11:10:26  4S 101E   34 8.4      77          1992/12/20 20:52:47  7S 130E   77 7.0      75          1976/05/17 02:58:40 40N  63E   15 6.7      90          2017/02/21 14:09:04 19S  64W  598 6.5      90          2017/02/21 14:09:04 19S  64W  598 6.5
 101E  69E  68W  94E 126E  63E  70W  67W      75  90   2  1979/03/15 12:52:29 23N 101E   33 6.2      78  93   2  1999/02/11 14:08:51 34N  69E   33 6.0      21  25   1  1994/06/09 00:33:16 14S  68W  631 8.2      56          2016/03/02 12:49:48  5S  94E   24 7.8      73  88   1  1975/10/31 08:28:02 13N 126E   50 7.2      75  89   1  1976/05/17 02:58:40 40N  63E   10 7.0      89          1988/02/05 14:01:04 25S  70W   37 7.2      93          1988/11/03 19:42:20 19N  67W   41 5.9
  63E  63E  70W  92E 121E  58E  71W  69W      75  89   1  1976/05/17 02:58:40 40N  63E   10 7.0      75  89   1  1976/05/17 02:58:40 40N  63E   10 7.0      16  20   1  1995/07/30 05:11:23 23S  70W   46 8.0      50          2012/04/11 10:43:10  1N  92E   25 8.2      63          1978/07/23 14:42:41 22N 121E   38 7.3      74          1983/04/08 02:28:28 11N  58E   15 6.5      83          1984/02/26 08:18:20 17S  71W  109 6.0      90          1975/06/05 20:29:40 16S  69W  210 5.5
  95E  27E  71W  92E  98E  63W  72W  72W      74  88   2  1988/08/06 00:36:24 25N  95E   91 7.3      77  92   1  1988/01/05 06:41:16 27S  27E    5 5.2      22  26   1  2014/04/01 23:46:47 20S  71W   25 8.2      50          2012/04/11 10:43:10  1N  92E   25 8.2      79          1984/11/17 06:49:30  0N  98E   28 7.1      79          2018/04/02 13:40:34 21S  63W  559 6.8      91          2010/03/11 15:06:04 34S  72W   32 6.0      91          2010/03/11 15:06:04 34S  72W   32 6.0
  93W  15E  74W  70W  95E  64W  72W  72W      73  88   1  1993/09/10 19:12:54 15N  93W   34 7.2      70  84   4  1980/11/23 18:34:53 41N  15E   10 6.9      40  48   3  2001/06/23 20:33:14 16S  74W   33 8.4      47  57   1  1987/03/05 09:17:05 24S  70W   62 7.6      74  88   2  1988/08/06 00:36:24 25N  95E   91 7.3      90          2017/02/21 14:09:04 19S  64W  598 6.5      87          2010/03/11 14:55:28 34S  72W   18 6.7      93          1985/06/13 01:58:09 37S  72W   55 5.0
 126E  13E  75W  71W  63E  70W  73W  73W      73  88   1  1975/10/31 08:28:02 13N 126E   50 7.2      67  80   1  1998/03/26 16:26:11 43N  13E   10 5.4      20          2019/05/26 07:41:15  6S  75W  123 8.0      59          2015/11/24 22:50:53 10S  71W  612 7.6      75  89   1  1976/05/17 02:58:40 40N  63E   10 7.0      89          1988/02/05 14:01:04 25S  70W   37 7.2      80  96   6  2010/01/12 21:53:10 18N  73W   13 7.0      92          1979/05/21 20:21:40  7N  73W   45 5.2
 140E  64W  77W  71W  70W  71W  77W  74W      71  85   1  1987/12/17 02:08:19 35N 140E   63 6.7      65  78   1  1985/03/19 10:28:36 19S  64W   33 5.8      17  21   3  2007/08/15 23:40:57 13S  77W   39 8.0      58          2015/11/24 22:45:38 11S  71W  601 7.6      89          1988/02/05 14:01:04 25S  70W   37 7.2      78  93   1  1987/08/13 15:23:06 18S  71W   37 6.6      84 100   1  1993/04/18 09:16:23 12S  77W  106 6.3      92          1991/07/29 13:52:39 14S  74W   96 5.5
  15E  71W 172W  80W  73W  72W  82W  76W      70  84   4  1980/11/23 18:34:53 41N  15E   10 6.9      78  93   1  1987/08/13 15:23:06 18S  71W   37 6.6      29  35   2  2009/09/29 17:48:10 15S 172W   18 8.1      62  74   1  1996/02/21 12:51:01 10S  80W   10 7.5      80  96   6  2010/01/12 21:53:10 18N  73W   13 7.0      87          2010/03/11 14:55:28 34S  72W   18 6.7      83          1999/12/01 19:23:06 18N  82W   10 6.3      90          1999/10/04 13:57:38 11S  76W   33 5.6
  97W  73W 174W  97W  93W  72W  86W  77W      68  82   2  1999/09/30 16:31:15 16N  97W   61 7.5      80  96   6  2010/01/12 21:53:10 18N  73W   13 7.0      45          2006/05/03 15:26:40 20S 174W   55 8.0      68  82   2  1999/09/30 16:31:15 16N  97W   61 7.5      66          1995/10/21 02:38:57 17N  93W  159 7.2      78          1985/03/19 04:01:09 33S  72W   46 6.7      91          2005/07/02 02:16:46 11N  86W   45 6.7      93          1973/01/30 15:03:23 46S  77W   33 5.3
 101E  73W 174W 103W  93W  73W 162W  86W      68  81   3  1981/01/23 21:13:51 31N 101E   33 6.8      82  99   1  1994/03/02 03:38:03 20N  73W   59 5.4      42          1995/04/07 22:06:56 15S 174W   21 8.1      64  76   2  1973/01/30 21:01:12 18N 103W   43 7.5      73  88   1  1993/09/10 19:12:54 15N  93W   34 7.2      80  96   6  2010/01/12 21:53:10 18N  73W   13 7.0      83          1991/05/30 13:17:41 55N 162W   28 6.8      91          2005/07/02 02:16:46 11N  86W   45 6.7
  13E  77W 175W 148W  97W  86W 172W 168W      67  80   1  1998/03/26 16:26:11 43N  13E   10 5.4      84 100   1  1993/04/18 09:16:23 12S  77W  106 6.3      54          1986/05/07 22:47:10 52N 175W   20 8.0      56          2002/11/03 22:12:41 64N 148W    5 7.9      68  82   2  1999/09/30 16:31:15 16N  97W   61 7.5      91          2005/07/02 02:16:46 11N  86W   45 6.7      82          2008/12/24 09:11:34 17S 172W    9 6.0     100          1974/01/19 08:53:39 53N 168W   59 5.0
  92E  93W 175W 175W 102W 162W 177W 178W      67  80   1  1988/02/06 14:50:45 25N  92E   33 5.9      73  88   1  1993/09/10 19:12:54 15N  93W   34 7.2      54          1986/05/07 22:47:10 52N 175W   33 8.0      54          1986/05/07 22:47:10 52N 175W   20 8.0      64  77   1  1981/10/25 03:22:15 18N 102W   33 7.3      83          1991/05/30 13:17:41 55N 162W   28 6.8      82          1998/11/15 02:44:12 22S 177W  149 6.3      91          1984/05/25 07:57:47 30S 178W   33 5.1
Table 1 in the above 9 horizontal groups of tables provides a quick summary of how many earthquakes occurred in the
past at around 73 W longitude where the Haiti earthquake
occurred. The matching 73 W entries are highlighted in bold text.1994/03/02 03:38:03 20N 73W 59 5.4That is almost an exact match for the latitude and longitude where the Haiti earthquake occurred. The depth and magnitude are quite different for the two earthquakes.
2010/01/12 21:53:10 18N 73W 13 7.0Finally, as stated earlier, there is more information related to that Haiti earthquake in the Significant Earthquake Related Table Data section of this Web page.
Table 1 Table 2 Table 3 Table 4 Table 5 Table 6 Table 7 Table 8 Table 9Table 1 - The "Summary" Table
Earthquake 2019/01/20 01:32:51 30.07S 71.42W 53 6.7 "15km SSW of Coquimbo, Chile" Table Longitudes Fatalities 2 Qual Lon 8.0+ 7.5+ 7.0+ 6.5+ 6.0+ 5.0+ Earthquake 2019/01/20 01:32:51 30S 71W 53 6.7 Earthquake 2019/01/20 01:32:51 30S 71W 53 6.7 Earthquake 2019/01/20 01:32:51 30S 71W 53 6.7 Earthquake 2019/01/20 01:32:51 30S 71W 53 6.7 Earthquake 2019/01/20 01:32:51 30S 71W 53 6.7 Earthquake 2019/01/20 01:32:51 30S 71W 53 6.7 Earthquake 2019/01/20 01:32:51 30S 71W 53 6.7 Earthquake 2019/01/20 01:32:51 30S 71W 53 6.7 Destructive Matches - Quality Sort Destructive Matches - Longitude Sort 8.0+ Mag - Longitude Sort 7.5+ Mag - Longitude Sort 7.0+ Mag - Longitude Sort 6.5+ Mag - Longitude Sort 6.0+ Mag - Longitude Sort 5.0+ Mag - Longitude Sort Lon Lon Lon Lon Lon Lon Lon Lon Pa Pd D# Earthquake UTC Date Lat Lon Depth Mag Pa Pd D# Earthquake UTC Date Lat Lon Depth Mag Pa Pd D# Earthquake UTC Date Lat Lon Depth Mag Pa Pd D# Earthquake UTC Date Lat Lon Depth Mag Pa Pd D# Earthquake UTC Date Lat Lon Depth Mag Pa Pd D# Earthquake UTC Date Lat Lon Depth Mag Pa Pd D# Earthquake UTC Date Lat Lon Depth Mag Pa Pd D# Earthquake UTC Date Lat Lon Depth Mag 135E 146E 161E 161E 180E 169E 174E 144E 91 100 4 1995/01/16 20:46:52 35N 135E 22 6.9 79 87 1 1993/10/16 03:05:30 6S 146E 27 6.3 34 1989/05/23 10:54:46 53S 161E 2 8.1 71 78 2 1977/04/21 04:24:09 10S 161E 33 7.5 76 1974/03/23 14:28:34 24S 180E 520 7.0 84 2017/11/19 15:09:03 22S 169E 17 6.6 85 2016/11/13 13:31:26 42S 174E 8 6.2 98 1987/07/09 19:10:24 4S 144E 112 5.0 136E 140E 161E 149E 161E 160E 172E 143E 88 96 2 1985/09/15 02:42:54 4S 136E 10 6.3 84 93 4 1976/06/25 19:18:56 5S 140E 33 7.1 34 1989/05/23 10:54:46 52S 161E 10 8.2 53 1995/12/03 18:01:08 45N 149E 33 7.9 66 1979/10/23 09:51:08 11S 161E 22 7.0 81 1987/10/06 20:11:36 53N 160E 34 6.5 84 1991/01/28 12:58:48 42S 172E 27 6.0 100 1981/01/19 14:02:35 38N 143E 33 5.2 71W 136E 155E 149E 161E 150E 169E 142E 87 95 1 2019/01/20 01:32:51 30S 71W 53 6.7 88 96 2 1985/09/15 02:42:54 4S 136E 10 6.3 18 2007/01/13 04:23:21 46N 155E 10 8.1 53 1995/12/03 18:01:08 45N 149E 33 7.9 71 78 2 1977/04/21 04:24:09 10S 161E 33 7.5 81 2013/07/07 20:30:07 6S 150E 62 6.6 84 2017/11/19 15:09:03 22S 169E 17 6.6 95 2012/05/05 20:12:35 38N 142E 66 5.1 43E 135E 153E 147E 148E 148E 169E 142E 85 93 2 2011/11/09 19:23:33 38N 43E 5 5.6 91 100 4 1995/01/16 20:46:52 35N 135E 22 6.9 34 2006/11/15 11:14:16 47N 153E 27 8.3 54 1978/12/06 14:02:08 45N 147E 145 7.8 82 1992/05/15 07:05:05 6S 148E 58 7.1 82 1992/05/15 07:05:05 6S 148E 58 7.1 85 2007/07/15 09:27:35 15S 169E 8 6.1 94 2001/02/24 21:53:54 37N 142E 0 5.5 140E 125E 153E 146E 145E 142E 167E 142E 84 93 4 1976/06/25 19:18:56 5S 140E 33 7.1 80 88 1 1977/08/27 07:12:22 8S 125E 25 6.8 34 2006/11/15 11:14:13 47N 153E 10 8.3 58 1973/06/17 03:55:03 43N 146E 44 7.8 68 1995/08/23 07:06:02 19N 145E 594 7.1 81 2008/05/07 16:45:20 36N 142E 37 6.8 84 2018/12/22 14:25:01 13S 167E 42 6.0 96 1995/03/16 08:11:16 42N 142E 20 5.1 77E 102E 152E 144E 143E 140E 143E 142E 82 90 2 1996/03/19 15:00:26 40N 77E 28 6.3 73 80 2 2008/08/30 08:30:53 26N 102E 11 6.0 37 2000/11/17 21:01:56 6S 152E 33 8.2 47 2003/09/25 19:50:06 42N 144E 33 8.3 63 69 4 1995/05/27 13:03:52 53N 143E 11 7.1 84 93 4 1976/06/25 19:18:56 5S 140E 33 7.1 88 1994/12/31 13:50:23 40N 143E 43 6.0 94 1994/01/12 21:22:37 4S 142E 118 5.0 7E 100E 152E 144E 140E 139E 140E 142E 80 88 2 1985/10/27 19:34:57 36N 7E 10 5.8 73 80 1 2014/10/07 13:49:39 23N 100E 9 6.1 18 20 1 2000/11/16 04:54:56 4S 152E 33 8.0 47 2000/03/28 11:00:22 22N 144E 126 7.6 84 93 4 1976/06/25 19:18:56 5S 140E 33 7.1 92 1986/03/24 19:31:40 2S 139E 24 6.7 91 2006/10/23 21:17:24 29N 140E 39 6.1 96 1986/06/08 21:33:41 31N 142E 33 5.1 44E 100E 147E 141E 126E 136E 140E 141E 80 88 3 1991/04/29 09:12:48 42N 44E 17 7.0 77 85 3 1990/04/26 09:37:10 36N 100E 10 6.3 45 49 2 1994/10/04 13:22:55 44N 147E 14 8.3 60 2011/03/11 06:15:40 36N 141E 39 7.9 62 1980/01/02 20:58:43 6N 126E 38 7.0 79 1994/04/13 22:22:29 3S 136E 28 6.5 84 93 4 1976/06/25 19:18:56 5S 140E 33 7.1 94 2010/02/28 08:17:45 35N 141E 10 5.6 125E 77E 145E 140E 123E 135E 139E 141E 80 88 1 1977/08/27 07:12:22 8S 125E 25 6.8 82 90 2 1996/03/19 15:00:26 40N 77E 28 6.3 40 1993/08/08 08:34:24 13N 145E 59 8.2 57 2015/05/30 11:23:02 28N 140E 678 7.8 70 2017/01/10 06:13:47 4N 123E 613 7.3 91 100 4 1995/01/16 20:46:52 35N 135E 22 6.9 87 2004/10/27 01:40:50 37N 139E 14 6.0 98 1985/08/29 14:10:32 28N 141E 12 5.1 146E 52E 144E 102E 102E 125E 139E 140E 79 87 1 1993/10/16 03:05:30 6S 146E 27 6.3 75 82 3 1983/03/25 11:57:49 36N 52E 33 5.2 47 2003/09/25 19:50:06 42N 144E 33 8.3 61 67 3 2000/06/04 16:28:26 5S 102E 33 7.9 61 67 3 2000/06/04 16:28:26 5S 102E 33 7.9 80 88 1 1977/08/27 07:12:22 8S 125E 25 6.8 92 1986/03/24 19:31:40 2S 139E 24 6.7 94 2009/01/26 08:54:21 37N 140E 132 5.0 11E 44E 144E 96E 101E 100E 136E 140E 78 86 1 2012/05/20 02:03:52 45N 11E 6 6.0 80 88 3 1991/04/29 09:12:48 42N 44E 17 7.0 47 2003/09/25 19:50:06 42N 144E 27 8.3 86 2008/02/20 08:08:30 3N 96E 26 7.5 64 70 4 1973/02/06 10:37:10 31N 101E 33 7.4 82 2007/09/13 03:35:28 2S 100E 22 7.0 88 96 2 1985/09/15 02:42:54 4S 136E 10 6.3 100 2001/07/05 02:15:42 32N 140E 33 5.3 28W 43E 142E 72E 100E 96E 135E 140E 78 85 1 1973/11/23 13:36:19 38N 28W 5 5.1 85 93 2 2011/11/09 19:23:33 38N 43E 5 5.6 41 45 5 2011/03/11 05:46:24 38N 142E 29 9.1 56 1983/11/30 17:46:02 7S 72E 10 7.7 82 2007/09/13 03:35:28 2S 100E 22 7.0 86 2008/02/20 08:08:30 3N 96E 26 7.5 91 100 4 1995/01/16 20:46:52 35N 135E 22 6.9 96 2001/07/05 02:05:49 32N 140E 33 5.3 100E 11E 118E 72W 96E 44E 96E 139E 77 85 3 1990/04/26 09:37:10 36N 100E 10 6.3 78 86 1 2012/05/20 02:03:52 45N 11E 6 6.0 45 49 3 1977/08/19 06:08:55 11S 118E 25 8.3 59 65 2 2015/09/16 22:54:32 32S 72W 22 8.3 86 2008/02/20 08:08:30 3N 96E 26 7.5 80 88 3 1991/04/29 09:12:48 42N 44E 17 7.0 86 2008/02/20 08:08:30 3N 96E 26 7.5 94 1994/02/10 14:52:14 2S 139E 22 5.0 52E 7E 101E 73W 44E 11W 11W 138E 75 82 3 1983/03/25 11:57:49 36N 52E 33 5.2 80 88 2 1985/10/27 19:34:57 36N 7E 10 5.8 25 28 2 2007/09/12 11:10:26 4S 101E 34 8.4 60 1975/05/10 14:27:43 38S 73W 30 7.7 80 88 3 1991/04/29 09:12:48 42N 44E 17 7.0 84 2012/08/30 13:43:25 71N 11W 14 6.8 84 2012/08/30 13:43:25 71N 11W 14 6.8 95 1976/11/06 07:57:24 35N 138E 176 5.0 81W 4E 93E 87W 30W 42W 42W 134E 75 82 2 1974/10/02 02:54:59 6S 81W 5 5.7 73 80 1 1973/11/24 14:05:46 36N 4E 17 5.1 25 27 1 2012/04/11 08:38:36 2N 93E 20 8.6 49 54 3 1992/09/02 00:16:01 12N 87W 45 7.7 64 1996/12/10 08:36:18 1N 30W 10 7.0 88 2008/02/08 09:38:14 11N 42W 9 6.9 88 2008/02/08 09:38:14 11N 42W 9 6.9 94 1974/11/28 13:22:39 2S 134E 17 5.1 99W 28W 72W 94W 42W 42W 42W 49E 74 81 1 2009/04/27 16:46:28 17N 99W 35 5.8 78 85 1 1973/11/23 13:36:19 38N 28W 5 5.1 59 65 2 2015/09/16 22:54:32 32S 72W 22 8.3 48 53 2 2017/09/08 04:49:19 15N 94W 47 8.2 86 1996/06/02 02:52:09 11N 42W 10 7.1 86 1996/06/02 02:52:09 11N 42W 10 7.1 86 1996/06/02 02:52:09 11N 42W 10 7.1 94 1990/07/06 19:34:52 37N 49E 34 5.3 4E 71W 94W 97W 66W 66W 71W 47E 73 80 1 1973/11/24 14:05:46 36N 4E 17 5.1 87 95 1 2019/01/20 01:32:51 30S 71W 53 6.7 48 53 2 2017/09/08 04:49:19 15N 94W 47 8.2 72 79 1 1978/11/29 19:52:47 16N 97W 18 7.7 83 1997/01/23 02:15:22 22S 66W 276 7.1 83 1997/01/23 02:15:22 22S 66W 276 7.1 87 95 1 2019/01/20 01:32:51 30S 71W 53 6.7 95 1998/10/04 00:42:47 33N 47E 10 5.3 102E 81W 104W 102W 72W 71W 128W 43W 73 80 2 2008/08/30 08:30:53 26N 102E 11 6.0 75 82 2 1974/10/02 02:54:59 6S 81W 5 5.7 63 69 2 1995/10/09 15:35:53 19N 104W 33 8.0 48 1985/09/21 01:37:13 18N 102W 18 7.6 66 72 1 2012/03/25 22:37:06 35S 72W 41 7.1 87 95 1 2019/01/20 01:32:51 30S 71W 53 6.7 89 1994/08/05 19:41:56 55S 128W 10 6.2 100 2010/02/27 19:54:30 11N 43W 10 5.4 100E 97W 172W 104W 97W 72W 129W 129W 73 80 1 2014/10/07 13:49:39 23N 100E 9 6.1 72 79 1 1978/11/29 19:52:47 16N 97W 18 7.7 36 40 2 2009/09/29 17:48:10 15S 172W 18 8.1 63 69 2 1995/10/09 15:35:53 19N 104W 33 8.0 72 79 1 1978/11/29 19:52:47 16N 97W 18 7.7 80 1997/07/06 09:54:00 30S 72W 19 6.8 87 1976/12/20 20:33:11 49N 129W 20 6.7 94 2007/03/03 20:52:09 55S 129W 10 5.7 97W 99W 176W 176W 104W 129W 132W 131W 72 79 1 1978/11/29 19:52:47 16N 97W 18 7.7 74 81 1 2009/04/27 16:46:28 17N 99W 35 5.8 44 1977/06/22 12:08:34 23S 176W 64 8.1 53 2011/07/06 19:03:17 29S 176W 20 7.6 63 69 2 1995/10/09 15:35:53 19N 104W 33 8.0 87 1976/12/20 20:33:11 49N 129W 20 6.7 88 2012/10/30 02:48:58 52N 132W 19 6.2 94 1987/03/30 03:13:40 75N 131W 10 5.3
Earthquake UTC Date Lat Lon Depth MagThat can happen because after the original, formally copyrighted computer program code was created quite a few years ago, for lack of time, no efforts were ever made to optimize the computer code. And the equations that the program uses don't always generate perfect matches between one earthquake an another.
1995/01/16 20:46:52 35N 135E 22 6.9
1985/09/15 02:42:54 4S 136E 10 6.3
Earthquake UTC Date Lat Lon Depth Mag

2015/09/16 22:54:32 32S  72W   22 8.3
1975/05/10 14:27:43 38S  73W   30 7.7
2012/03/25 22:37:06 35S  72W   41 7.1
1997/07/06 09:54:00 30S  72W   19 6.8
The above 4 earthquakes were listed in Tables 4 through 9. Because of the way that the computer program does its calculations, earthquake latitudes are not considered, only their longitudes. In spite of that, the above four earthquakes from Tables 4 through 9 were reasonably good latitude and longitude matches with the Chile earthquake. The 1997 6.8 magnitude earthquake is an especially good match, even with regards to its magnitude.
 Table 1                                     Table 2                                                Table 3                                                Table 4                                                Table 5                                                Table 6                                                Table 7                                                Table 8                                                Table 9

 Earthquake   2014/04/01 23:46:47 19.61S  70.77W  25 8.2 "94km NW of Iquique, Chile"
 Table Longitudes                            Fatalities   6

 Qual  Lon 8.0+ 7.5+ 7.0+ 6.5+ 6.0+ 5.0+     Earthquake   2014/04/01 23:46:47 20S 71W 25 8.2        Earthquake   2014/04/01 23:46:47 20S 71W 25 8.2        Earthquake   2014/04/01 23:46:47 20S 71W 25 8.2        Earthquake   2014/04/01 23:46:47 20S 71W 25 8.2        Earthquake   2014/04/01 23:46:47 20S 71W 25 8.2        Earthquake   2014/04/01 23:46:47 20S 71W 25 8.2        Earthquake   2014/04/01 23:46:47 20S 71W 25 8.2        Earthquake   2014/04/01 23:46:47 20S 71W 25 8.2
                                                          Destructive Matches - Quality Sort                     Destructive Matches - Longitude Sort                   8.0+ Mag - Longitude Sort                              7.5+ Mag - Longitude Sort                              7.0+ Mag - Longitude Sort                              6.5+ Mag - Longitude Sort                              6.0+ Mag - Longitude Sort                              5.0+ Mag - Longitude Sort

 Lon  Lon  Lon  Lon  Lon  Lon  Lon  Lon       Pa  Pd  D#  Earthquake UTC Date Lat Lon Depth Mag      Pa  Pd  D#  Earthquake UTC Date Lat Lon Depth Mag      Pa  Pd  D#  Earthquake UTC Date Lat Lon Depth Mag      Pa  Pd  D#  Earthquake UTC Date Lat Lon Depth Mag      Pa  Pd  D#  Earthquake UTC Date Lat Lon Depth Mag      Pa  Pd  D#  Earthquake UTC Date Lat Lon Depth Mag      Pa  Pd  D#  Earthquake UTC Date Lat Lon Depth Mag      Pa  Pd  D#  Earthquake UTC Date Lat Lon Depth Mag
  71W 139E 165E 166E 161E 161E 160E 122E      94 100   1  2014/04/01 23:46:47 20S  71W   25 8.2      75  79   1  1983/08/08 03:47:57 35N 139E   25 5.7      51  54   2  2013/02/06 01:12:25 11S 165E   24 8.0      61          1980/07/17 19:42:24 12S 166E   32 7.8      82          1977/04/20 23:49:12 10S 161E   16 7.1      82          1977/04/20 23:49:12 10S 161E   16 7.1      87          1977/04/20 23:42:54 10S 160E   39 7.3      94          1990/06/24 05:29:26  0N 122E  153 5.1
 124E 125E 161E 165E 160E 160E 156E 122E      87  92   2  2000/05/04 04:21:16  1S 124E   26 7.6      79  83   2  2004/11/11 21:26:41  8S 125E   10 7.5      13          2004/12/23 14:59:04 49S 161E   10 8.1      51  54   2  2013/02/06 01:12:25 11S 165E   24 8.0      87          1977/04/20 23:42:54 10S 160E   39 7.3      87          1977/04/20 23:42:54 10S 160E   39 7.3      87          2018/10/10 23:16:02 49N 156E   17 6.5      94          1978/12/01 17:10:29  9N 122E   40 5.8
  21E 124E 157E 153E 151E 156E 150E 119E      82  87   1  1991/07/12 10:42:21 45N  21E   11 5.6      87  92   2  2000/05/04 04:21:16  1S 124E   26 7.6      13  13   1  2007/04/01 20:39:58  8S 157E   24 8.1      62          2005/09/09 07:26:43  5S 153E   90 7.7      73          2000/07/16 03:57:45  8S 151E   10 7.3      87          2018/10/10 23:16:02 49N 156E   17 6.5      87          1984/12/24 05:32:34  6S 150E   56 6.1      95          1985/09/15 22:58:42 11S 119E   39 5.3
  22E 122E 155E 144E 125E 156E 142E 119E      82  86   1  1990/12/21 06:57:42 41N  22E   13 6.1      79  84   1  1977/03/18 21:43:52 17N 122E   37 7.0      22          2007/01/13 04:23:21 46N 155E   10 8.1      48  51   1  1993/01/15 11:06:05 43N 144E  102 7.6      79  83   2  2004/11/11 21:26:41  8S 125E   10 7.5      80          1996/10/14 23:26:20  7S 156E   24 6.9      87          1998/01/01 06:11:22 24N 142E   95 6.6     100          1978/03/11 11:54:42 11S 119E   33 5.5
  70W 121E 155E 143E 124E 142E 127E 119E      81  86   1  1998/01/30 12:16:08 24S  70W   42 7.1      72  76   1  2000/05/17 03:25:48 24N 121E   10 5.4      22          2007/01/13 04:23:21 46N 155E   10 8.1      58  61   2  2018/02/25 17:44:44  6S 143E   35 7.5      87  92   2  2000/05/04 04:21:16  1S 124E   26 7.6      87          1998/01/01 06:11:22 24N 142E   95 6.6      88          2011/04/05 11:14:15  3N 127E   18 6.0      98          1978/03/10 17:25:30 11S 119E   33 5.3
  63W  99E 152E 142E 123E 129E 125E 118E      80  85   2  1997/07/09 19:24:13 11N  63W   20 7.0      73  77   1  1995/07/11 21:46:39 22N  99E   13 6.8      21          2000/11/17 21:01:56  6S 152E   33 8.2      55  59   2  1978/06/12 08:14:26 38N 142E   44 7.7      86          1996/06/17 11:22:18  7S 123E  587 7.9      79          1992/09/26 22:15:57  1N 129E   27 6.5      84          1979/11/19 22:17:22  6N 125E   90 6.4      94          2007/07/17 00:06:01 50S 118E   10 5.1
  76W  52E 150E 127E 122E 124E 124E 118E      80  85   2  1996/11/12 16:59:44 15S  76W   33 7.7      71  76   1  1988/08/11 16:00:07 30N  52E   32 5.8      13          1998/03/25 03:12:25 63S 150E   10 8.8      48  51   1  1989/12/15 18:43:45  8N 127E   24 7.6      79  84   1  1977/03/18 21:43:52 17N 122E   37 7.0      87  92   2  2000/05/04 04:21:16  1S 124E   26 7.6      87  92   2  2000/05/04 04:21:16  1S 124E   26 7.6      94          2002/10/06 16:23:28  8S 118E   10 5.0
 122E  52E 150E 125E  91E 123E 124E 118E      79  84   1  1977/03/18 21:43:52 17N 122E   37 7.0      72  76   1  1986/07/12 07:54:26 30N  52E   10 5.7      12          1998/03/25 03:12:25 63S 150E   10 8.1      79  83   2  2004/11/11 21:26:41  8S 125E   10 7.5      75          2001/11/14 09:26:10 36N  91E   10 7.9      86          1996/06/17 11:22:18  7S 123E  587 7.9      84          1976/11/22 04:22:25  7N 124E   60 6.0      94          1977/09/16 12:22:50 10S 118E   33 5.2
 125E  44E 145E 125E  44E 122E 123E  31E      79  83   2  2004/11/11 21:26:41  8S 125E   10 7.5      73  78   1  2005/01/25 16:44:16 38N  44E   41 5.9      21          1993/08/08 08:34:24 13N 145E   59 8.2      68          1984/11/20 08:15:15  5N 125E  180 7.5      78  82   4  1976/11/24 12:22:18 39N  44E   36 7.3      83          1983/06/24 09:06:47 24N 122E   49 6.6      86          1996/06/17 11:22:18  7S 123E  587 7.9      96          2003/05/03 11:22:40 37N  31E  130 5.0
  44E  44E 118E 124E  21W 122E 122E  30E      78  82   4  1976/11/24 12:22:18 39N  44E   36 7.3      78  82   4  1976/11/24 12:22:18 39N  44E   36 7.3      21  22   3  1977/08/19 06:08:55 11S 118E   25 8.3      87  92   2  2000/05/04 04:21:16  1S 124E   26 7.6      75          2006/01/02 06:10:49 61S  21W   10 7.4      79          1977/07/21 13:45:55 17N 122E   36 6.9      86          2015/04/20 11:45:13 24N 122E   29 6.0      96          1974/04/25 00:03:49  1N  30E   33 5.0
  27E  27E 101E 123E  25W 122E 122E  28E      75  80   2  1990/10/18 09:30:44 26S  27E    5 4.0      75  80   2  1990/10/18 09:30:44 26S  27E    5 4.0      47  50   2  2007/09/12 11:10:26  4S 101E   34 8.4      86          1996/06/17 11:22:18  7S 123E  587 7.9      76          1983/10/22 04:21:34 61S  25W    5 7.1      79  84   1  1977/03/18 21:43:52 17N 122E   37 7.0      92          1989/08/03 11:31:22 23N 122E   14 6.4      95          1998/05/28 18:33:28 31N  28E   10 5.5
 139E  23E  93E 113E  63W  63W 119E  26E      75  79   1  1983/08/08 03:47:57 35N 139E   25 5.7      72  76   1  1981/03/07 11:34:44 38N  23E   33 5.5      25  26   1  2012/04/11 08:38:36  2N  93E   20 8.6      59  63   3  1994/06/02 18:17:34 10S 113E   18 7.8      80  85   2  1997/07/09 19:24:13 11N  63W   20 7.0      80  85   2  1997/07/09 19:24:13 11N  63W   20 7.0      84          2016/12/29 22:30:19  9S 119E   79 6.3      97          2018/02/17 05:18:29 53S  26E   10 5.0
  44E  23E  68W 101E  70W  70W 119E  26E      73  78   1  2005/01/25 16:44:16 38N  44E   41 5.9      72  76   1  1978/07/04 22:23:28 41N  23E   19 5.1      18  19   1  1994/06/09 00:33:16 14S  68W  631 8.2      47  50   2  2007/09/12 11:10:26  4S 101E   34 8.4      81  86   1  1998/01/30 12:16:08 24S  70W   42 7.1      81  86   1  1998/01/30 12:16:08 24S  70W   42 7.1      90          2000/10/30 12:01:30 10S 119E   33 6.0      93          2000/04/05 04:36:58 34N  26E   38 5.6
  99E  22E  70W  91E  71W  71W 100E  61W      73  77   1  1995/07/11 21:46:39 22N  99E   13 6.8      82  86   1  1990/12/21 06:57:42 41N  22E   13 6.1      21  22   1  1995/07/30 05:11:23 23S  70W   46 8.0      75          2001/11/14 09:26:10 36N  91E   10 7.9      94 100   1  2014/04/01 23:46:47 20S  71W   25 8.2      94 100   1  2014/04/01 23:46:47 20S  71W   25 8.2      84          2005/04/10 17:24:39  2S 100E   30 6.4      96          1997/04/08 17:11:53 11N  61W    5 5.5
 121E  21E  71W  70E  73W  73W  96E  64W      72  76   1  2000/05/17 03:25:48 24N 121E   10 5.4      82  87   1  1991/07/12 10:42:21 45N  21E   11 5.6      94 100   1  2014/04/01 23:46:47 20S  71W   25 8.2      62  66   3  2015/10/26 09:09:42 37N  70E  231 7.5      83          1974/08/18 10:44:10 38S  73W    9 7.1      83          1974/08/18 10:44:10 38S  73W    9 7.1      84          1987/03/02 05:57:46 46S  96E   21 6.1      93          2018/03/02 04:42:15 22S  64W  525 5.4
  70W  63W  77W  71W  76W  76W  70W  65W      72  76   1  1987/08/08 15:48:56 19S  70W   70 7.2      80  85   2  1997/07/09 19:24:13 11N  63W   20 7.0      48  51   3  2007/08/15 23:40:57 13S  77W   39 8.0      94 100   1  2014/04/01 23:46:47 20S  71W   25 8.2      76          2012/09/30 16:31:35  2N  76W  170 7.3      80  85   2  1996/11/12 16:59:44 15S  76W   33 7.7      86          2014/04/01 23:58:00 19S  70W   18 6.2      94          2017/01/29 17:38:49 58S  65W   10 5.4
  52E  70W 103W  74W  76W  77W  71W  66W      72  76   1  1986/07/12 07:54:26 30N  52E   10 5.7      81  86   1  1998/01/30 12:16:08 24S  70W   42 7.1      47  50   4  1985/09/19 13:17:47 18N 103W   28 8.0      53          2016/12/25 14:22:27 43S  74W   38 7.6      80  85   2  1996/11/12 16:59:44 15S  76W   33 7.7      82          2010/08/12 11:54:16  1S  77W  211 7.1      94 100   1  2014/04/01 23:46:47 20S  71W   25 8.2      97          2007/12/11 17:20:59 62S  66W   36 5.9
  23E  70W 172W  76W  77W 124W  71W  70W      72  76   1  1978/07/04 22:23:28 41N  23E   19 5.1      72  76   1  1987/08/08 15:48:56 19S  70W   70 7.2      31  33   2  2009/09/29 17:48:10 15S 172W   18 8.1      80  85   2  1996/11/12 16:59:44 15S  76W   33 7.7      82          2010/08/12 11:54:16  1S  77W  211 7.1      83          1980/11/08 10:27:35 41N 124W   17 7.3      93          1979/04/28 11:38:19 28S  71W   28 6.1      95          1995/07/30 05:50:03 23S  70W   33 5.4
  23E  71W 174W  77W 124W 153W 123W  71W      72  76   1  1981/03/07 11:34:44 38N  23E   33 5.5      94 100   1  2014/04/01 23:46:47 20S  71W   25 8.2      29          2006/05/03 15:26:40 20S 174W   55 8.0      48  51   3  2007/08/15 23:40:57 13S  77W   39 8.0      83          1980/11/08 10:27:35 41N 124W   17 7.3      82          2016/01/24 10:30:30 60N 153W  128 7.1      85          1995/01/04 06:28:39 56S 123W   10 6.0      94 100   1  2014/04/01 23:46:47 20S  71W   25 8.2
  52E  76W 174W 101W 153W 178W 177W 155W      71  76   1  1988/08/11 16:00:07 30N  52E   32 5.8      80  85   2  1996/11/12 16:59:44 15S  76W   33 7.7      31          1995/04/07 22:06:56 15S 174W   21 8.1      69  73   2  1979/03/14 11:07:16 18N 101W   49 7.6      82          2016/01/24 10:30:30 60N 153W  128 7.1      82          2003/01/04 05:15:03 21S 178W  378 6.5      85          2012/04/23 17:36:21 28S 177W  116 6.0      96          1985/02/22 05:48:29 19N 155W   10 5.0
Pa Pd D# Earthquake UTC Date Lat Lon Depth MagAdditionally, the original earthquake appeared in each of the Tables 4 through 9 as the highest quality match with itself out of more than 100,000 past 5 and higher magnitude earthquakes. That is in spite of the fact that the earthquake's had a very high magnitude relative to ones in the 5.0 range and above.
94 100 1 2014/04/01 23:46:47 20S 71W 25 8.2
Pa Pd D# Earthquake UTC Date Lat Lon Depth MagFinally, 3 other Chile area earthquakes (1 of them deadly) were identified as being among the 20 best matches out of more than 100,000 past 5 and higher magnitude earthquakes.
81 86 1 1998/01/30 12:16:08 24S 70W 42 7.1
72 76 1 1987/08/08 15:48:56 19S 70W 70 7.2
 Pa  Pd  D#  Earthquake UTC Date Lat Lon Depth Mag
 21  22   1  1995/07/30 05:11:23 23S  70W   46 8.0
 86          2014/04/01 23:58:00 19S  70W   18 6.2
 93          1979/04/28 11:38:19 28S  71W   28 6.1
 Table 1                                     Table 2                                                Table 3                                                Table 4                                                Table 5                                                Table 6                                                Table 7                                                Table 8                                                Table 9

 Earthquake   2010/01/12 21:53:10 18.44N  72.57W  13 7.0 "Haiti region"
 Table Longitudes                            Fatalities   250000

 Qual  Lon 8.0+ 7.5+ 7.0+ 6.5+ 6.0+ 5.0+     Earthquake   2010/01/12 21:53:10 18N 73W 13 7          Earthquake   2010/01/12 21:53:10 18N 73W 13 7          Earthquake   2010/01/12 21:53:10 18N 73W 13 7          Earthquake   2010/01/12 21:53:10 18N 73W 13 7          Earthquake   2010/01/12 21:53:10 18N 73W 13 7          Earthquake   2010/01/12 21:53:10 18N 73W 13 7          Earthquake   2010/01/12 21:53:10 18N 73W 13 7          Earthquake   2010/01/12 21:53:10 18N 73W 13 7
                                                          Destructive Matches - Quality Sort                     Destructive Matches - Longitude Sort                   8.0+ Mag - Longitude Sort                              7.5+ Mag - Longitude Sort                              7.0+ Mag - Longitude Sort                              6.5+ Mag - Longitude Sort                              6.0+ Mag - Longitude Sort                              5.0+ Mag - Longitude Sort

 Lon  Lon  Lon  Lon  Lon  Lon  Lon  Lon       Pa  Pd  D#  Earthquake UTC Date Lat Lon Depth Mag      Pa  Pd  D#  Earthquake UTC Date Lat Lon Depth Mag      Pa  Pd  D#  Earthquake UTC Date Lat Lon Depth Mag      Pa  Pd  D#  Earthquake UTC Date Lat Lon Depth Mag      Pa  Pd  D#  Earthquake UTC Date Lat Lon Depth Mag      Pa  Pd  D#  Earthquake UTC Date Lat Lon Depth Mag      Pa  Pd  D#  Earthquake UTC Date Lat Lon Depth Mag      Pa  Pd  D#  Earthquake UTC Date Lat Lon Depth Mag
 104E 140E 165E 179E 179E 179E 179E 104E     100 100   2  1976/08/23 03:30:07 32N 104E   33 6.7      75  75   1  1987/12/17 02:08:19 35N 140E   63 6.7      20  20   2  2013/02/06 01:12:25 11S 165E   24 8.0      86          2014/06/23 20:53:09 52N 179E  107 7.9      86          2014/06/23 20:53:09 52N 179E  107 7.9      86          2014/06/23 20:53:09 52N 179E  107 7.9      86          2014/06/23 20:53:09 52N 179E  107 7.9     100 100   2  1976/08/23 03:30:07 32N 104E   33 6.7
  73W 126E 161E 154E 178E 154E 130E 103E      94  94   6  2010/01/12 21:53:10 18N  73W   13 7.0      84  84   1  1975/10/31 08:28:02 13N 126E   50 7.2      40          2004/12/23 14:59:04 49S 161E   10 8.1      56          1995/08/16 10:27:28  6S 154E   30 7.8      74          2003/03/17 16:36:17 51N 178E   33 7.4      79          2008/11/24 09:02:58 54N 154E  492 7.3      84          1992/12/20 20:52:47  7S 130E   77 7.0      92          2008/04/02 08:48:49  4S 103E   67 5.8
  77W 110E 150E 153E 166E 150E 127E 101E      88  88   1  1993/04/18 09:16:23 12S  77W  106 6.3      87  87   4  2006/05/26 22:53:58  8S 110E   13 6.3      78          1998/03/25 03:12:25 63S 150E   10 8.8      50          2019/05/14 12:58:26  4S 153E   10 7.5      76          2013/02/06 01:54:15 10S 166E   10 7.0      82          1998/03/25 03:12:25 63S 150E   10 8.1      86          1976/06/26 10:30:56  4N 127E    7 6.5      95          1994/08/05 03:39:05  3S 101E   68 5.5
  95E 104E 150E 150E 154E 146E 110E 100E      87  87   1  2006/12/17 21:10:21  5N  95E   36 5.8     100 100   2  1976/08/23 03:30:07 32N 104E   33 6.7      82          1998/03/25 03:12:25 63S 150E   10 8.1      78          1998/03/25 03:12:25 63S 150E   10 8.8      79          2008/11/24 09:02:58 54N 154E  492 7.3      81          1993/10/13 03:07:30  6S 146E   33 6.7      87  87   4  2006/05/26 22:53:58  8S 110E   13 6.3      99          2019/02/02 09:58:11  3S 100E   10 5.3
 110E 102E 145E 150E 150E 142E 107E 100E      87  87   4  2006/05/26 22:53:58  8S 110E   13 6.3      85  85   2  1995/10/23 22:46:50 26N 102E   10 6.2      19          1993/08/08 08:34:24 13N 145E   59 8.2      82          1998/03/25 03:12:25 63S 150E   10 8.1      78          1998/03/25 03:12:25 63S 150E   10 8.8      79          1996/02/16 15:22:58 37N 142E   40 6.7      91          1996/12/09 03:54:16  8S 107E   50 6.1      92          2009/08/16 20:23:43  1S 100E   23 5.2
 102E 101E 101E 145E 150E 130E 106E 100E      85  85   2  1995/10/23 22:46:50 26N 102E   10 6.2      83  83   2  1979/03/15 12:52:29 23N 101E   33 6.2      71  71   2  2007/09/12 11:10:26  4S 101E   34 8.4      73          2012/08/14 02:59:42 50N 145E  625 7.7      82          1998/03/25 03:12:25 63S 150E   10 8.1      84          1992/12/20 20:52:47  7S 130E   77 7.0      87          2000/10/25 09:32:23  7S 106E   38 6.8      92          2005/08/30 20:59:08  2S 100E   29 5.2
 126E  95E  97E 143E 130E 127E 104E 100E      84  84   1  1975/10/31 08:28:02 13N 126E   50 7.2      87  87   1  2006/12/17 21:10:21  5N  95E   36 5.8      15          2000/06/18 14:44:13 14S  97E   10 8.0      49          2002/09/08 18:44:26  3S 143E   33 7.5      84          1992/12/20 20:52:47  7S 130E   77 7.0      84          2014/11/21 10:10:19  2N 127E   38 6.5     100 100   2  1976/08/23 03:30:07 32N 104E   33 6.7      92          1993/07/17 09:46:34 28N 100E   30 5.8
 101E  44E  93E 131E 126E 127E 102E 100E      83  83   2  1979/03/15 12:52:29 23N 101E   33 6.2      80  80   2  2004/07/01 22:30:09 40N  44E    5 5.1      20  20   1  2012/04/11 08:38:36  2N  93E   20 8.6      61          1973/09/29 00:44:01 42N 131E  570 7.8      84  84   1  1975/10/31 08:28:02 13N 126E   50 7.2      86          1976/06/26 10:30:56  4N 127E    7 6.5      85  85   2  1995/10/23 22:46:50 26N 102E   10 6.2      97          1989/05/03 15:41:32 30N 100E    3 5.6
  38E  38E  92E 101E 101E 126E  99E  99E      83  83   1  1986/06/06 10:39:46 38N  38E   10 5.8      83  83   1  1986/06/06 10:39:46 38N  38E   10 5.8      43          2012/04/11 10:43:10  1N  92E   25 8.2      76          2007/09/12 23:49:04  3S 101E   30 7.9      76          2007/09/12 23:49:04  3S 101E   30 7.9      84  84   1  1975/10/31 08:28:02 13N 126E   50 7.2      88          2009/08/16 07:38:21  1S  99E   20 6.6      92          2009/08/18 09:28:59  1S  99E   35 5.1
  64W  35E  92E 101E  98E 106E  58E  13E      80  80   1  1985/03/19 10:28:36 19S  64W   33 5.8      74  74   1  1995/11/22 04:15:11 29N  35E   10 7.2      47          2012/04/11 10:43:10  1N  92E   25 8.2      71  71   2  2007/09/12 11:10:26  4S 101E   34 8.4      78          1984/11/17 06:49:30  0N  98E   28 7.1      87          2000/10/25 09:32:23  7S 106E   38 6.8      85          1995/05/26 03:11:17 12N  58E   62 6.5      95          1976/02/27 09:58:47 46N  13E   33 5.2
  44E  20E  71W  92E  35E 104E  68W  72W      80  80   2  2004/07/01 22:30:09 40N  44E    5 5.1      75  75   1  1982/11/16 23:41:21 41N  20E   21 5.6      18  18   1  2014/04/01 23:46:47 20S  71W   25 8.2      47          2012/04/11 10:43:10  1N  92E   25 8.2      74  74   1  1995/11/22 04:15:11 29N  35E   10 7.2     100 100   2  1976/08/23 03:30:07 32N 104E   33 6.7      87          2001/06/19 09:32:24 23S  68W  146 6.0      92          1993/07/16 21:21:26 33S  72W   30 5.7
  13E  13E  72W  80W  73W  99E  72W  73W      80  80   1  1998/03/26 16:26:11 43N  13E   10 5.4      80  80   1  1998/03/26 16:26:11 43N  13E   10 5.4      16  16   3  1985/03/03 22:47:07 33S  72W   33 8.0      73  73   1  1996/02/21 12:51:01 10S  80W   10 7.5      94  94   6  2010/01/12 21:53:10 18N  73W   13 7.0      88          2009/08/16 07:38:21  1S  99E   20 6.6      88          2010/03/11 14:55:28 34S  72W   18 6.7      94  94   6  2010/01/12 21:53:10 18N  73W   13 7.0
 102W   4W  74W  97W  92W  71E  72W  73W      78  78   1  1981/10/25 03:22:15 18N 102W   33 7.3      75  75   1  1992/10/23 09:11:09 31N   4W   29 5.6      25  25   3  2001/06/23 20:33:14 16S  74W   33 8.4      55  55   2  1999/09/30 16:31:15 16N  97W   61 7.5      79          1983/12/02 03:09:03 14N  92W   35 7.0      81          1981/05/02 16:04:56 36N  71E  220 6.5      87          1985/03/19 04:01:09 33S  72W   46 6.7      93          2007/01/17 16:08:48 17S  73W   56 5.0
 140E  64W  77W 103W  93W  58E  73W  74W      75  75   1  1987/12/17 02:08:19 35N 140E   63 6.7      80  80   1  1985/03/19 10:28:36 19S  64W   33 5.8      17  17   3  2007/08/15 23:40:57 13S  77W   39 8.0      69  69   2  1973/01/30 21:01:12 18N 103W   43 7.5      78          1995/10/21 02:38:57 17N  93W  159 7.2      85          1995/05/26 03:11:17 12N  58E   62 6.5      94  94   6  2010/01/12 21:53:10 18N  73W   13 7.0      98          2016/01/07 15:40:43 42S  74W   24 5.0
   4W  73W 172W 132W 102W  72W  77W  74W      75  75   1  1992/10/23 09:11:09 31N   4W   29 5.6      94  94   6  2010/01/12 21:53:10 18N  73W   13 7.0      32  32   2  2009/09/29 17:48:10 15S 172W   18 8.1      46          2012/10/28 03:04:09 53N 132W   20 7.8      78  78   1  1981/10/25 03:22:15 18N 102W   33 7.3      88          2010/03/11 14:55:28 34S  72W   18 6.7      88  88   1  1993/04/18 09:16:23 12S  77W  106 6.3      93          2013/06/05 09:14:53  8S  74W  152 5.2
  20E  73W 174W 148W 148W  72W  78W  74W      75  75   1  1982/11/16 23:41:21 41N  20E   21 5.6      74  74   1  1994/03/02 03:38:03 20N  73W   59 5.4      47          2006/05/03 15:26:40 20S 174W   55 8.0      78          2002/11/03 22:12:41 64N 148W    5 7.9      78          2002/11/03 22:12:41 64N 148W    5 7.9      87          1985/03/19 04:01:09 33S  72W   46 6.7      91          1978/04/04 21:11:39 10N  78W    8 6.2      93          1989/05/02 02:33:30 42S  74W   29 5.1
  35E  77W 174W 174W 172W  73W  79W  76W      74  74   1  1995/11/22 04:15:11 29N  35E   10 7.2      88  88   1  1993/04/18 09:16:23 12S  77W  106 6.3      38          1995/04/07 22:06:56 15S 174W   21 8.1      47          2006/05/03 15:26:40 20S 174W   55 8.0      74          1987/10/06 04:19:08 18S 172W   22 7.3      94  94   6  2010/01/12 21:53:10 18N  73W   13 7.0      89          1995/09/23 22:31:56 11S  79W   59 6.5      94          2018/12/06 04:17:24 15S  76W   10 5.0
  90W  80W 175W 175W 175W  79W 172W  83W      74  74   1  1995/12/19 20:56:06 15N  90W   10 5.4      73  73   1  1996/02/21 12:51:01 10S  80W   10 7.5      75          1986/05/07 22:47:10 52N 175W   20 8.0      75          1986/05/07 22:47:10 52N 175W   20 8.0      75          1986/05/07 22:47:10 52N 175W   20 8.0      89          1995/09/23 22:31:56 11S  79W   59 6.5      90          2014/02/26 21:13:40 54N 172W  265 6.1      93          1973/01/02 03:47:52  5N  83W   30 5.2
  73W  90W 175W 175W 175W  92W 172W 168W      74  74   1  1994/03/02 03:38:03 20N  73W   59 5.4      74  74   1  1995/12/19 20:56:06 15N  90W   10 5.4      78          1986/05/07 22:47:10 52N 175W   33 8.0      78          1986/05/07 22:47:10 52N 175W   33 8.0      78          1986/05/07 22:47:10 52N 175W   33 8.0      79          1983/12/02 03:09:03 14N  92W   35 7.0      92          2008/12/24 09:11:34 17S 172W    9 6.0      97          1977/05/15 15:50:47 52N 168W   33 5.3
  80W 102W 178W 177W 178W 180W 177W 174W      73  73   1  1996/02/21 12:51:01 10S  80W   10 7.5      78  78   1  1981/10/25 03:22:15 18N 102W   33 7.3      33          2018/08/19 00:19:37 18S 178W  563 8.2      49          1997/10/14 09:53:18 22S 177W  167 7.8      73          1981/12/26 17:05:31 30S 178W   21 7.1      79          1979/11/16 15:21:24 17S 180W    6 6.8      86          1998/11/15 02:44:12 22S 177W  149 6.3      95          1979/12/16 21:27:56 20S 174W   39 5.5
Pa Pd D# Earthquake UTC Date Lat Lon Depth MagAdditionally, the original earthquake appeared in each of the Tables 6 (7 and higher magnitude) through 9 as the highest quality match with itself out of more than 100,000 past 5 and higher magnitude earthquakes.
94 94 6 2010/01/12 21:53:10 18N 73W 13 7.0
Pa Pd D# Earthquake UTC Date Lat Lon Depth MagThat 1994 location was the same latitude and longitude as the 2010 earthquake.
74 74 1 1994/03/02 03:38:03 20N 73W 59 5.4
Pa Pd D# Earthquake UTC Date Lat Lon Depth MagIt can be seen that of those 10 earthquakes listed above (11 if the original Haiti earthquake is counted), only the deadly one that occurred in 1994 was at a north latitude. The others were to the south.
16 16 3 1985/03/03 22:47:07 33S 72W 33 8.0
25 25 3 2001/06/23 20:33:14 16S 74W 33 8.4
88 2010/03/11 14:55:28 34S 72W 18 6.7
87 1985/03/19 04:01:09 33S 72W 46 6.7
92 1993/07/16 21:21:26 33S 72W 30 5.7
93 2007/01/17 16:08:48 17S 73W 56 5.0
98 2016/01/07 15:40:43 42S 74W 24 5.0
93 2013/06/05 09:14:53 8S 74W 152 5.2
93 1989/05/02 02:33:30 42S 74W 29 5.1
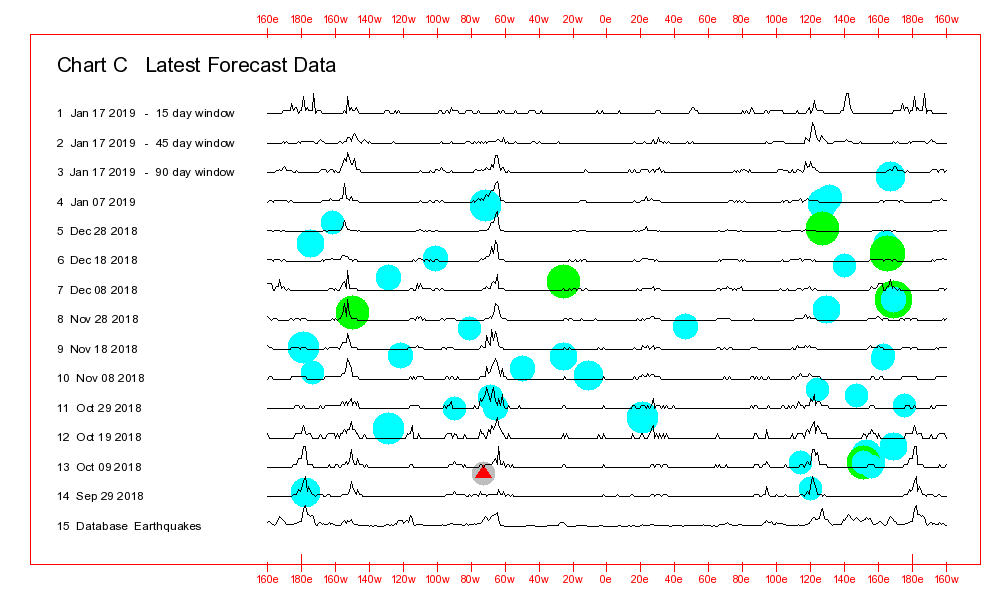
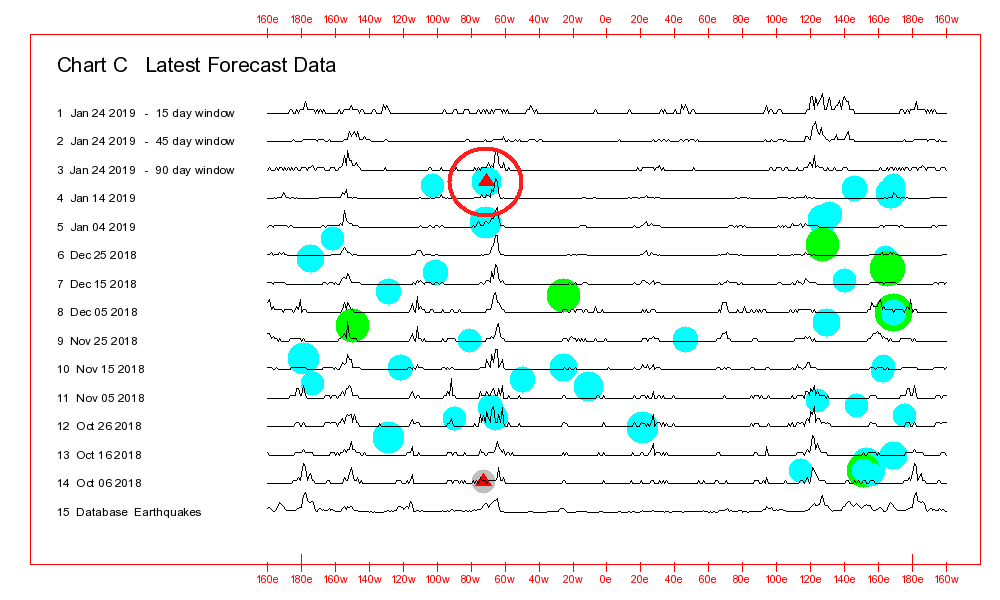
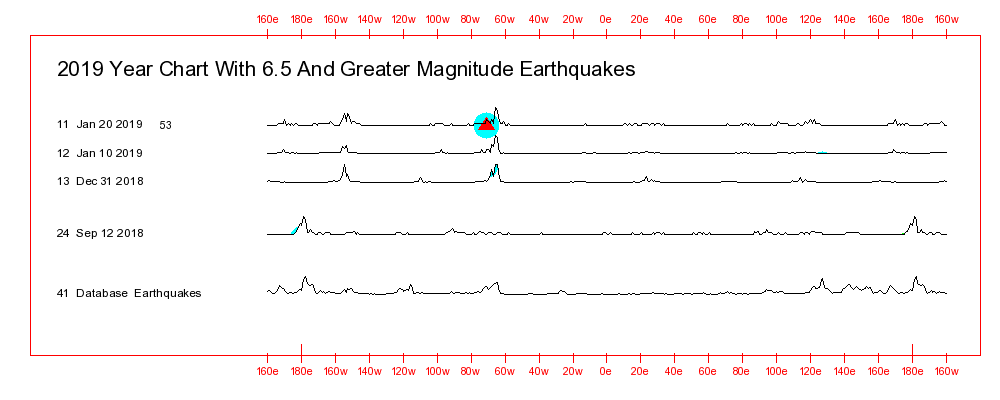
Table 1A Table 2A Table 3A Table 4 Table 5 Table 6 Table 7 Table 8 Table 9
Line # 13 Line Date 2019/01/08 Line # 13 Line # 13 Line # 13 Line # 13 Line # 13 Line # 13 Line # 13 Line # 13
Table Longitudes Line Date 2019/01/08 Line Date 2019/01/08 Line Date 2019/01/08 Line Date 2019/01/08 Line Date 2019/01/08 Line Date 2019/01/08 Line Date 2019/01/08 Line Date 2019/01/08
Destructive Matches - Quality Sort Destructive Matches - Longitude Sort 8.0+ Mag - Longitude Sort 7.5+ Mag - Longitude Sort 7.0+ Mag - Longitude Sort 6.5+ Mag - Longitude Sort 6.0+ Mag - Longitude Sort 5.0+ Mag - Longitude Sort
Qual Lon 8.0+ 7.5+ 7.0+ 6.5+ 6.0+ 5.0+
Pa Pd D# Earthquake UTC Date Lat Lon Depth Mag Pa Pd D# Earthquake UTC Date Lat Lon Depth Mag Pa Pd D# Earthquake UTC Date Lat Lon Depth Mag Pa Pd D# Earthquake UTC Date Lat Lon Depth Mag Pa Pd D# Earthquake UTC Date Lat Lon Depth Mag Pa Pd D# Earthquake UTC Date Lat Lon Depth Mag Pa Pd D# Earthquake UTC Date Lat Lon Depth Mag Pa Pd D# Earthquake UTC Date Lat Lon Depth Mag
71W 124E 165E 162E 170E 169E 166E 117E 98 100 1 1997/11/06 02:34:33 47N 71W 23 4.8 95 97 2 2000/05/04 04:21:16 1S 124E 26 7.6 84 86 2 2013/02/06 01:12:25 11S 165E 24 8.0 89 2014/04/12 20:14:39 11S 162E 29 7.6 92 1986/01/15 20:17:31 21S 170E 140 7.1 94 1994/02/12 17:58:23 21S 169E 27 7.2 96 1992/04/05 11:46:35 12S 166E 48 6.4 98 1979/06/02 09:48:00 31S 117E 6 6.0
70W 121E 161E 161E 169E 166E 121E 117E 97 99 1 1998/01/30 12:16:08 24S 70W 42 7.1 92 94 2 1994/11/14 19:15:30 14N 121E 32 7.1 86 2004/12/23 14:59:04 49S 161E 10 8.1 88 2016/12/08 17:38:46 11S 161E 41 7.8 94 1994/02/12 17:58:23 21S 169E 27 7.2 95 1985/12/16 08:04:10 14S 166E 52 6.5 96 98 1 1988/06/19 20:19:52 12N 121E 17 6.2 98 1979/06/02 09:47:58 31S 117E 3 6.1
30E 121E 153E 125E 167E 166E 117E 116E 97 99 3 1995/10/01 15:57:16 38N 30E 33 6.4 96 98 1 1988/06/19 20:19:52 12N 121E 17 6.2 71 2013/05/24 05:44:49 55N 153E 608 8.3 89 91 2 2004/11/11 21:26:41 8S 125E 10 7.5 92 2015/10/20 21:52:02 15S 167E 127 7.1 95 1985/12/16 08:03:14 14S 166E 54 6.5 98 1979/06/02 09:48:00 31S 117E 6 6.0 98 1983/02/26 16:00:14 11S 116E 33 5.0
121E 121E 153E 124E 161E 124E 117E 114E 96 98 1 1988/06/19 20:19:52 12N 121E 17 6.2 94 96 1 1985/04/24 01:07:14 16N 121E 33 6.1 71 2013/05/24 05:44:48 55N 153E 598 8.3 95 97 2 2000/05/04 04:21:16 1S 124E 26 7.6 92 1977/04/20 23:49:12 10S 161E 16 7.1 95 97 2 2000/05/04 04:21:16 1S 124E 26 7.6 98 1979/06/02 09:47:58 31S 117E 3 6.1 98 1994/06/09 16:37:46 10S 114E 33 5.8
27E 117E 150E 123E 125E 123E 30E 114E 95 98 1 1999/04/22 22:19:36 28S 27E 5 5.7 95 97 1 2019/03/17 07:07:27 8S 117E 24 5.5 73 1998/03/25 03:12:25 63S 150E 10 8.8 94 1996/06/17 11:22:18 7S 123E 587 7.9 92 1988/02/24 03:52:06 13N 125E 40 7.3 94 1996/06/17 11:22:18 7S 123E 587 7.9 97 99 3 1995/10/01 15:57:16 38N 30E 33 6.4 98 1978/01/14 14:55:52 11S 114E 42 5.4
71W 99E 150E 101E 124E 120E 22E 110E 95 97 1 2014/04/01 23:46:47 20S 71W 25 8.2 94 96 1 1995/07/11 21:46:39 22N 99E 13 6.8 73 1998/03/25 03:12:25 63S 150E 10 8.1 88 2007/09/12 23:49:04 3S 101E 30 7.9 95 97 2 2000/05/04 04:21:16 1S 124E 26 7.6 96 2018/08/17 15:35:02 7S 120E 539 6.5 99 2008/02/14 10:09:22 37N 22E 29 6.9 98 1986/06/14 15:33:56 6S 110E 563 5.7
124E 34E 101E 101E 123E 22E 20E 26E 95 97 2 2000/05/04 04:21:16 1S 124E 26 7.6 93 95 1 2002/05/18 15:15:08 3S 34E 10 5.5 89 91 2 2007/09/12 11:10:26 4S 101E 34 8.4 89 91 2 2007/09/12 11:10:26 4S 101E 34 8.4 94 1996/06/17 11:22:18 7S 123E 587 7.9 99 2008/02/14 10:09:22 37N 22E 29 6.9 96 1983/01/17 12:41:30 38N 20E 6 6.9 98 2001/05/24 17:34:01 46N 26E 141 5.3
117E 30E 97E 70E 122E 20E 63W 23E 95 97 1 2019/03/17 07:07:27 8S 117E 24 5.5 97 99 3 1995/10/01 15:57:16 38N 30E 33 6.4 73 2000/06/18 14:44:13 14S 97E 10 8.0 89 91 3 2015/10/26 09:09:42 37N 70E 231 7.5 92 1984/08/06 12:01:53 0N 122E 244 7.4 96 1983/01/17 12:41:30 38N 20E 6 6.9 97 2011/09/02 13:47:11 28S 63W 93 6.7 98 2018/01/02 04:24:17 41N 23E 6 5.1
23E 27E 93E 68W 121E 10W 66W 23E 94 96 1 1981/03/07 11:34:44 38N 23E 33 5.5 95 98 1 1999/04/22 22:19:36 28S 27E 5 5.7 74 75 1 2012/04/11 08:38:36 2N 93E 20 8.6 88 90 1 1994/06/09 00:33:16 14S 68W 631 8.2 92 94 2 1994/11/14 19:15:30 14N 121E 32 7.1 95 1975/04/16 01:27:19 71N 10W 7 6.5 98 2010/01/17 12:00:02 58S 66W 10 6.3 98 2012/09/21 08:47:40 35N 23E 16 5.0
121E 23E 92E 69W 68W 63W 66W 23E 94 96 1 1985/04/24 01:07:14 16N 121E 33 6.1 94 96 1 1981/03/07 11:34:44 38N 23E 33 5.5 74 2012/04/11 10:43:10 1N 92E 25 8.2 86 88 2 2005/06/13 22:44:33 20S 69W 116 7.8 94 1974/01/02 10:42:33 22S 68W 121 7.1 97 2011/09/02 13:47:11 28S 63W 93 6.7 97 2007/07/21 15:34:52 22S 66W 290 6.4 98 2009/05/24 16:17:50 41N 23E 1 5.3
99E 22E 92E 70W 70W 70W 70W 23E 94 96 1 1995/07/11 21:46:39 22N 99E 13 6.8 93 95 1 1990/12/21 06:57:42 41N 22E 13 6.1 74 2012/04/11 10:43:10 1N 92E 25 8.2 86 2014/04/03 02:43:17 20S 70W 40 7.6 97 99 1 1998/01/30 12:16:08 24S 70W 42 7.1 97 99 1 1998/01/30 12:16:08 24S 70W 42 7.1 97 2018/01/21 01:06:42 19S 70W 111 6.3 99 1986/10/05 05:12:15 35N 23E 15 5.0
70W 21E 68W 71W 70W 71W 70W 22E 93 95 1 1987/08/08 15:48:56 19S 70W 70 7.2 93 95 1 1991/07/12 10:42:21 45N 21E 11 5.6 88 90 1 1994/06/09 00:33:16 14S 68W 631 8.2 95 97 1 2014/04/01 23:46:47 20S 71W 25 8.2 93 95 1 1987/08/08 15:48:56 19S 70W 70 7.2 95 97 1 2014/04/01 23:46:47 20S 71W 25 8.2 98 2014/04/01 23:58:00 19S 70W 18 6.2 99 2008/02/14 10:09:22 37N 22E 29 6.9
22E 14E 71W 74W 71W 71W 70W 61W 93 95 1 1990/12/21 06:57:42 41N 22E 13 6.1 92 94 1 1998/04/12 10:55:32 46N 14E 10 5.6 95 97 1 2014/04/01 23:46:47 20S 71W 25 8.2 86 2016/12/25 14:22:27 43S 74W 38 7.6 95 97 1 2014/04/01 23:46:47 20S 71W 25 8.2 95 1998/01/12 10:14:07 31S 71W 34 6.6 97 99 1 1998/01/30 12:16:08 24S 70W 42 7.1 98 2016/12/06 21:42:21 11N 61W 35 5.9
34E 13E 74W 74W 73W 71W 71W 64W 93 95 1 2002/05/18 15:15:08 3S 34E 10 5.5 92 94 3 2009/04/06 01:32:39 42N 13E 9 6.3 86 88 3 2001/06/23 20:33:14 16S 74W 33 8.4 86 88 3 2001/06/23 20:33:14 16S 74W 33 8.4 97 1974/08/18 10:44:10 38S 73W 9 7.1 96 1988/08/14 17:53:11 27S 71W 36 6.7 97 2014/04/04 01:37:51 21S 71W 20 6.1 99 2010/01/23 09:40:35 17S 64W 10 5.2
21E 70W 77W 76W 76W 71W 71W 65W 93 95 1 1991/07/12 10:42:21 45N 21E 11 5.6 97 99 1 1998/01/30 12:16:08 24S 70W 42 7.1 76 77 3 2007/08/15 23:40:57 13S 77W 39 8.0 90 92 2 1996/11/12 16:59:44 15S 76W 33 7.7 94 2012/09/30 16:31:35 2N 76W 170 7.3 94 1985/05/01 13:27:57 9S 71W 606 6.6 97 1979/04/28 11:38:19 28S 71W 28 6.1 99 2017/01/29 17:38:49 58S 65W 10 5.4
72W 70W 103W 80W 77W 73W 73W 66W 93 95 2 1991/07/23 19:44:50 16S 72W 5 5.3 93 95 1 1987/08/08 15:48:56 19S 70W 70 7.2 77 79 4 1985/09/19 13:17:47 18N 103W 28 8.0 90 91 1 1996/02/21 12:51:01 10S 80W 10 7.5 92 2010/08/12 11:54:16 1S 77W 211 7.1 97 1974/08/18 10:44:10 38S 73W 9 7.1 97 1974/08/18 10:44:10 38S 73W 9 7.1 98 2010/01/17 12:00:02 58S 66W 10 6.3
13E 71W 174W 101W 98W 74W 74W 71W 92 94 3 2009/04/06 01:32:39 42N 13E 9 6.3 95 97 1 2014/04/01 23:46:47 20S 71W 25 8.2 89 2006/05/03 15:26:40 20S 174W 55 8.0 92 94 2 1979/03/14 11:07:16 18N 101W 49 7.6 91 2018/02/16 23:39:42 17N 98W 25 7.2 97 1989/12/03 14:16:50 8S 74W 160 6.5 97 1989/12/03 14:16:50 8S 74W 160 6.5 98 1995/07/30 06:00:08 24S 71W 33 5.3
121E 71W 174W 174W 98W 77W 98W 72W 92 94 2 1994/11/14 19:15:30 14N 121E 32 7.1 98 100 1 1997/11/06 02:34:33 47N 71W 23 4.8 89 1995/04/07 22:06:56 15S 174W 21 8.1 89 2006/05/03 15:26:40 20S 174W 55 7.9 97 1996/02/25 03:08:15 16N 98W 21 7.1 96 1995/05/02 06:06:05 4S 77W 97 6.7 97 1996/02/25 09:17:57 16N 98W 12 6.2 99 2015/09/20 09:02:33 30S 72W 17 5.2
101W 72W 175W 174W 101W 98W 98W 154W 92 94 2 1979/03/14 11:07:16 18N 101W 49 7.6 93 95 2 1991/07/23 19:44:50 16S 72W 5 5.3 75 1986/05/07 22:47:10 52N 175W 20 8.0 89 2006/05/03 15:26:40 20S 174W 55 8.0 92 94 2 1979/03/14 11:07:16 18N 101W 49 7.6 97 1996/02/25 03:08:15 16N 98W 21 7.1 97 1996/02/25 03:08:15 16N 98W 21 7.1 99 2000/05/08 20:41:39 57N 154W 43 5.0
14E 101W 175W 174W 157W 157W 157W 157W 92 94 1 1998/04/12 10:55:32 46N 14E 10 5.6 92 94 2 1979/03/14 11:07:16 18N 101W 49 7.6 75 1986/05/07 22:47:10 52N 175W 33 8.0 89 1995/04/07 22:06:56 15S 174W 21 8.1 95 1989/09/04 13:14:59 56N 157W 6 7.1 95 1989/09/04 13:14:59 56N 157W 6 7.1 99 1990/05/01 16:12:21 59N 157W 211 6.3 99 1990/05/01 16:12:21 59N 157W 211 6.3
Table 1B Table 2B Table 3B Table 4 Table 5 Table 6 Table 7 Table 8 Table 9
Line # 24 Line Date 2018/09/20 Line # 24 Line # 24 Line # 24 Line # 24 Line # 24 Line # 24 Line # 24 Line # 24
Table Longitudes Line Date 2018/09/20 Line Date 2018/09/20 Line Date 2018/09/20 Line Date 2018/09/20 Line Date 2018/09/20 Line Date 2018/09/20 Line Date 2018/09/20 Line Date 2018/09/20
Destructive Matches - Quality Sort Destructive Matches - Longitude Sort 8.0+ Mag - Longitude Sort 7.5+ Mag - Longitude Sort 7.0+ Mag - Longitude Sort 6.5+ Mag - Longitude Sort 6.0+ Mag - Longitude Sort 5.0+ Mag - Longitude Sort
Qual Lon 8.0+ 7.5+ 7.0+ 6.5+ 6.0+ 5.0+
Pa Pd D# Earthquake UTC Date Lat Lon Depth Mag Pa Pd D# Earthquake UTC Date Lat Lon Depth Mag Pa Pd D# Earthquake UTC Date Lat Lon Depth Mag Pa Pd D# Earthquake UTC Date Lat Lon Depth Mag Pa Pd D# Earthquake UTC Date Lat Lon Depth Mag Pa Pd D# Earthquake UTC Date Lat Lon Depth Mag Pa Pd D# Earthquake UTC Date Lat Lon Depth Mag Pa Pd D# Earthquake UTC Date Lat Lon Depth Mag
27E 140E 165E 179E 179E 179E 179E 180E 97 100 1 1988/01/05 06:41:16 27S 27E 5 5.2 93 96 1 1980/09/24 17:54:24 35N 140E 73 6.0 69 71 2 2013/02/06 01:12:25 11S 165E 24 8.0 96 2014/06/23 20:53:09 52N 179E 107 7.9 96 2014/06/23 20:53:09 52N 179E 107 7.9 96 2014/06/23 20:53:09 52N 179E 107 7.9 96 2014/06/23 20:53:09 52N 179E 107 7.9 98 1990/10/04 17:33:02 20S 180E 599 5.3
1W 140E 161E 172E 150E 141E 177E 179E 96 99 2 1999/12/22 17:36:56 35N 1W 10 5.6 92 95 1 1974/08/03 18:16:34 36N 140E 58 5.6 61 2004/12/23 14:59:04 49S 161E 10 8.1 82 1981/07/06 03:08:25 22S 172E 30 7.6 90 1998/03/25 03:12:25 63S 150E 10 8.8 92 2001/12/02 13:01:53 40N 141E 122 6.5 94 2014/06/24 03:15:36 52N 177E 4 6.3 98 1991/01/31 12:49:48 30S 179E 581 5.1
101E 126E 150E 169E 150E 126E 142E 178E 94 97 2 1979/03/15 12:52:29 23N 101E 33 6.2 93 96 1 1975/10/31 08:28:02 13N 126E 50 7.2 90 1998/03/25 03:12:25 63S 150E 10 8.8 83 2018/12/05 04:18:08 22S 169E 10 7.5 89 1998/03/25 03:12:25 63S 150E 10 8.1 93 96 1 1975/10/31 08:28:02 13N 126E 50 7.2 96 2005/12/16 18:32:17 39N 142E 43 6.0 98 2001/09/04 13:01:47 16S 178E 10 5.2
121E 125E 150E 150E 143E 121E 124E 123E 94 97 1 1999/09/25 23:52:48 24N 121E 17 6.5 90 93 1 1995/05/14 11:33:18 8S 125E 11 6.9 89 1998/03/25 03:12:25 63S 150E 10 8.1 90 1998/03/25 03:12:25 63S 150E 10 8.8 89 2002/09/08 18:44:26 3S 143E 33 7.5 94 97 1 1999/09/25 23:52:48 24N 121E 17 6.5 97 2018/08/28 07:08:09 11S 124E 9 6.2 98 1983/03/30 00:49:08 2N 123E 23 5.5
126E 121E 145E 150E 130E 121E 122E 122E 93 96 1 1975/10/31 08:28:02 13N 126E 50 7.2 94 97 1 1999/09/25 23:52:48 24N 121E 17 6.5 61 1993/08/08 08:34:24 13N 145E 59 8.2 89 1998/03/25 03:12:25 63S 150E 10 8.1 89 1992/12/20 20:52:47 7S 130E 77 7.0 93 1989/07/31 17:07:29 8S 121E 13 6.6 95 1998/07/24 18:44:04 21N 122E 33 6.4 98 1983/09/23 12:29:25 24N 122E 36 5.8
140E 118E 118E 145E 126E 104E 101E 118E 93 96 1 1980/09/24 17:54:24 35N 140E 73 6.0 90 93 3 2004/03/24 01:53:49 45N 118E 19 5.5 62 64 3 1977/08/19 06:08:55 11S 118E 25 8.3 84 2012/08/14 02:59:42 50N 145E 625 7.7 93 96 1 1975/10/31 08:28:02 13N 126E 50 7.2 94 1985/12/27 05:38:55 6S 104E 26 6.5 94 97 2 1979/03/15 12:52:29 23N 101E 33 6.2 99 1977/08/30 12:58:56 10S 118E 33 5.0
4W 104E 101E 143E 93E 88E 96E 94E 93 96 1 1992/10/23 09:11:09 31N 4W 29 5.6 90 94 2 1976/08/23 03:30:07 32N 104E 33 6.7 71 73 2 2007/09/12 11:10:26 4S 101E 34 8.4 89 2002/09/08 18:44:26 3S 143E 33 7.5 89 93 1 2012/01/10 18:36:59 2N 93E 19 7.2 94 2003/09/27 18:52:46 50N 88E 10 6.6 94 1997/08/20 07:15:15 4N 96E 33 6.0 98 2004/12/27 18:37:52 3N 94E 28 5.0
1E 101E 93E 131E 1E 25E 35E 88E 93 96 4 1980/10/10 12:25:23 36N 1E 10 7.3 91 95 1 1998/11/19 11:38:14 27N 101E 33 5.6 66 68 1 2012/04/11 08:38:36 2N 93E 20 8.6 83 1973/09/29 00:44:01 42N 131E 570 7.8 93 96 4 1980/10/10 12:25:23 36N 1E 10 7.3 93 1983/08/06 15:43:55 40N 25E 15 6.7 94 1993/08/03 12:43:05 29N 35E 10 6.1 99 1988/09/27 19:10:10 27N 88E 33 5.0
83W 101E 92E 94E 14W 1E 71W 75W 92 96 1 2003/12/25 07:11:11 8N 83W 33 6.5 94 97 2 1979/03/15 12:52:29 23N 101E 33 6.2 79 2012/04/11 10:43:10 1N 92E 25 8.2 82 2016/03/02 12:49:48 5S 94E 24 7.8 89 1996/02/18 23:49:28 1S 14W 10 7.0 93 96 4 1980/10/10 12:25:23 36N 1E 10 7.3 94 2015/11/26 05:45:18 9S 71W 599 6.7 98 2010/06/28 00:59:47 38S 75W 14 5.5
13E 100E 92E 70W 14W 63W 72W 75W 92 95 1 1998/03/26 16:26:11 43N 13E 10 5.4 91 94 1 1989/05/07 00:38:18 24N 100E 33 5.6 79 2012/04/11 10:43:10 1N 92E 25 8.2 83 85 1 1987/03/05 09:17:05 24S 70W 62 7.6 87 1992/08/28 18:18:46 1S 14W 15 7.1 92 2018/04/02 13:40:34 21S 63W 559 6.8 95 2011/07/16 00:26:14 34S 72W 23 6.0 98 1985/09/01 01:00:55 20N 75W 10 5.1
140E 93E 71W 71W 53W 71W 80W 151W 92 95 1 1974/08/03 18:16:34 36N 140E 58 5.6 89 93 1 2012/01/10 18:36:59 2N 93E 19 7.2 64 66 1 2014/04/01 23:46:47 20S 71W 25 8.2 86 2015/11/24 22:50:53 10S 71W 612 7.6 88 1983/07/11 12:56:29 61S 53W 9 7.0 94 2015/11/26 05:45:18 9S 71W 599 6.7 95 2017/12/03 11:19:06 0N 80W 25 6.0 99 1977/08/30 06:50:39 63N 151W 130 5.0
101E 51E 72W 71W 70W 76W 86W 175W 91 95 1 1998/11/19 11:38:14 27N 101E 33 5.6 89 92 1 1992/03/04 11:57:53 32N 51E 18 5.1 65 67 2 2015/09/16 22:54:32 32S 72W 22 8.3 88 2015/11/24 22:45:38 11S 71W 601 7.6 88 1988/02/05 14:01:04 25S 70W 37 7.2 93 2011/10/28 18:54:34 15S 76W 24 6.9 94 2005/07/02 02:16:46 11N 86W 45 6.7 98 2006/10/08 18:54:56 24S 175W 10 5.3
100E 27E 74W 148W 71W 76W 93W 175W 91 94 1 1989/05/07 00:38:18 24N 100E 33 5.6 97 100 1 1988/01/05 06:41:16 27S 27E 5 5.2 63 65 3 2001/06/23 20:33:14 16S 74W 33 8.4 85 2002/11/03 22:12:41 64N 148W 5 7.9 86 2015/11/24 22:50:53 10S 71W 612 7.6 93 1997/09/02 12:13:22 4N 76W 198 6.8 94 1992/05/30 16:30:01 14N 93W 54 6.4 99 1987/02/15 06:58:59 15S 175W 33 5.0
73W 15E 172W 149W 71W 83W 150W 178W 91 94 6 2010/01/12 21:53:10 18N 73W 13 7.0 89 92 4 1980/11/23 18:34:53 41N 15E 10 6.9 62 65 2 2009/09/29 17:48:10 15S 172W 18 8.1 82 2018/01/23 09:31:42 56N 149W 25 7.9 88 2015/11/24 22:45:38 11S 71W 601 7.6 92 96 1 2003/12/25 07:11:11 8N 83W 33 6.5 94 1985/03/09 14:08:05 66N 150W 9 6.0 99 2013/02/27 06:49:55 31S 178W 31 5.1
104E 13E 174W 174W 73W 86W 173W 178W 90 94 2 1976/08/23 03:30:07 32N 104E 33 6.7 92 95 1 1998/03/26 16:26:11 43N 13E 10 5.4 81 2006/05/03 15:26:40 20S 174W 55 8.0 81 2006/05/03 15:26:40 20S 174W 55 7.9 91 94 6 2010/01/12 21:53:10 18N 73W 13 7.0 94 2005/07/02 02:16:46 11N 86W 45 6.7 95 1985/06/03 12:06:24 15S 173W 46 6.6 97 1987/09/07 17:43:39 31S 178W 40 5.7
125E 1E 174W 174W 154W 173W 174W 178W 90 93 1 1995/05/14 11:33:18 8S 125E 11 6.9 93 96 4 1980/10/10 12:25:23 36N 1E 10 7.3 82 1995/04/07 22:06:56 15S 174W 21 8.1 81 2006/05/03 15:26:40 20S 174W 55 8.0 91 1999/12/06 23:12:33 57N 154W 66 7.0 95 1985/06/03 12:06:24 15S 173W 46 6.6 96 1993/12/13 11:43:44 20S 174W 33 6.0 99 1979/04/14 00:53:19 27S 178W 223 5.4
118E 1W 175W 174W 175W 176W 176W 179W 90 93 3 2004/03/24 01:53:49 45N 118E 19 5.5 96 99 2 1999/12/22 17:36:56 35N 1W 10 5.6 87 1986/05/07 22:47:10 52N 175W 20 8.0 82 1995/04/07 22:06:56 15S 174W 21 8.1 87 1986/05/07 22:47:10 52N 175W 20 8.0 93 1974/07/03 23:25:11 29S 176W 37 6.6 95 2006/02/26 04:18:42 15S 176W 33 6.0 98 2005/04/24 11:43:50 33S 179W 10 5.0
93E 4W 175W 175W 175W 177W 178W 179W 89 93 1 2012/01/10 18:36:59 2N 93E 19 7.2 93 96 1 1992/10/23 09:11:09 31N 4W 29 5.6 87 1986/05/07 22:47:10 52N 175W 33 8.0 87 1986/05/07 22:47:10 52N 175W 20 8.0 87 1986/05/07 22:47:10 52N 175W 33 8.0 93 2006/03/31 13:21:00 29S 177W 10 6.5 94 1987/08/26 06:56:47 21S 178W 575 6.0 98 1999/01/17 17:55:33 30S 179W 329 5.4
51E 73W 176W 175W 177W 179W 178W 179W 89 92 1 1992/03/04 11:57:53 32N 51E 18 5.1 91 94 6 2010/01/12 21:53:10 18N 73W 13 7.0 62 1977/06/22 12:08:34 23S 176W 64 8.1 87 1986/05/07 22:47:10 52N 175W 33 8.0 88 1997/10/14 09:53:18 22S 177W 167 7.8 92 1993/04/16 14:08:38 18S 179W 565 6.9 96 1984/09/22 21:44:17 32S 178W 39 6.0 100 1998/02/12 18:51:17 17S 179W 33 5.5
15E 83W 178W 177W 179W 179W 179W 180W 89 92 4 1980/11/23 18:34:53 41N 15E 10 6.9 92 96 1 2003/12/25 07:11:11 8N 83W 33 6.5 71 2018/08/19 00:19:37 18S 178W 563 8.2 88 1997/10/14 09:53:18 22S 177W 167 7.8 91 2004/07/15 04:27:11 17S 179W 560 7.1 93 1981/09/28 17:56:18 29S 179W 322 6.5 94 2009/04/26 00:06:54 30S 179W 142 6.1 98 1975/07/24 19:01:42 23S 180W 564 5.6
 Line # 9    Line Date: 2019/02/17
 Table Longitudes

 Qual  Lon 8.0+ 7.5+ 7.0+ 6.5+ 6.0+ 5.0+

 134E 140E 155E 166E 168E 146E 143E 143E
 122E 137E 153E 166E 150E 146E 143E 143E
  30E 134E 153E 142E 146E 139E 143E 143E
 104E 122E 152E 141E 143E 134E 142E 142E
 118E 121E 150E 134E 142E 129E 142E 142E
 115E 118E 150E 120E 141E 127E 142E 142E
 142E 115E 147E 100E 134E 124E 134E 142E
  84W 104E 144E  70E 129E 124E 123E 141E
  77E 101E 144E  66E 127E 123E 122E 141E
 121E  96E 142E  30E 124E 121E 121E 141E
  31E  77E 101E  22W 124E 121E 120E 141E
  44E  70E  97E  72W 121E 120E  99E 141E
  56E  56E  96E  73W 121E 104E  98E 141E
  96E  47E  72W  76W  99E  99E  79E 140E
  27E  44E  73W  79W  31E  71E  30E 140E
 137E  31E 104W  97W  30E  30E  24E 140E
 140E  30E 174W 173W 176W  72W  83W  53E
  70E  27E 174W 176W 178W 176W 161W  44W
 101E  84W 176W 179W 178W 178W 179W 127W


 Line # 10   Line Date: 2019/02/07
 Table Longitudes

 Qual  Lon 8.0+ 7.5+ 7.0+ 6.5+ 6.0+ 5.0+

  27E 121E 161E 162E 160E 126E 135E 120E
  71W 121E 150E 161E 155E 125E 126E 119E
 117E 121E 150E 150E 148E 124E 125E 117E
  96E 121E 145E 150E 144E 122E 120E 117E
 121E 119E 101E 143E 126E 121E 117E 106E
  13E 117E  97E 131E 125E 120E 117E 102E
  60E 104E  96E 124E 122E  96E  30E 101E
 121E 102E  93E 123E 121E  22E  22E 101E
 121E  96E  92E 101E  60E  68W  66W  68W
 121E  93E  92E  76W  39W  74W  66W  70W
  50E  60E  71W  79W  68W  78W  74W  71W
  63W  50E  72W  80W  77W  91W  82W  74W
   5E  30E  73W 132W  86W 174W 157W  77W
  13E  27E 172W 148W  98W 174W 173W 146W
 102E  13E 174W 174W 125W 174W 173W 152W
 125E  13E 174W 174W 157W 177W 174W 152W
  93E   5E 175W 174W 174W 177W 174W 168W
 104E  63W 175W 175W 174W 179W 174W 169W
 119E  71W 176W 175W 174W 179W 179W 178W


 Line # 11   Line Date: 2019/01/28
 Table Longitudes

 Qual  Lon 8.0+ 7.5+ 7.0+ 6.5+ 6.0+ 5.0+

 117E 121E 161E 172E 160E 125E 126E 122E
  27E 121E 150E 162E 144E 124E 125E 122E
 121E 121E 150E 161E 126E 122E 124E 120E
  71W 121E 145E 143E 125E 121E 120E 120E
  96E 121E 101E 125E 124E 120E 117E 119E
  13E 119E  97E 124E 123E  96E 117E 119E
  63W 117E  93E 123E 122E  23E  30E 117E
 121E  99E  92E 101E 121E  22E  22E 106E
 121E  96E  92E  70E  60E  68W  66W 102E
  73E  93E  68W  71W  39W  74W  66W  65W
 121E  73E  71W  80W  68W  78W  68W  66W
  93E  60E  74W 132W  70W  91W  73W  68W
 121E  30E  77W 148W  71W 174W  82W  70W
  27E  27E 103W 149W  98W 174W 157W  71W
   5E  27E 172W 174W 125W 174W 173W  71W
  60E  13E 174W 174W 157W 177W 174W  98W
 125E   5E 174W 174W 174W 177W 174W 152W
 119E  63W 175W 175W 174W 179W 174W 152W
  99E  71W 175W 175W 174W 179W 179W 168W


 Line # 12   Line Date: 2019/01/18
 Table Longitudes

 Qual  Lon 8.0+ 7.5+ 7.0+ 6.5+ 6.0+ 5.0+

 117E 124E 161E 162E 167E 126E 124E 170E
  27E 121E 150E 161E 161E 125E 122E 169E
  71W 121E 150E 125E 160E 124E 121E 122E
 121E 121E 101E 124E 126E 122E 121E 120E
 121E 121E  97E 123E 125E 121E 121E 120E
 121E 117E  93E 121E 124E 121E 120E 120E
  13E  99E  92E 101E 123E 121E 117E 119E
  34E  96E  92E 101E 122E 120E 117E 119E
 124E  50E  68W  70E 121E  22E  80E 117E
  70W  34E  70W  71W  39W  63W  30E 117E
  92W  30E  71W  76W  68W  68W  27E 102E
  96E  27E  74W  80W  70W  74W  22E 101E
 125E  23E  77W 101W  73W  78W  66W  65W
  72W  13E 103W 132W  98W  94W  66W  68W
  50E  63W 172W 148W 125W  98W  74W  71W
  99E  70W 174W 149W 157W 102W  98W  98W
  63W  71W 174W 174W 174W 157W  98W 100W
  23E  72W 175W 174W 174W 174W  99W 152W
 121E  92W 175W 174W 174W 174W 157W 157W


 Line # 13   Line Date: 2019/01/08
 Table Longitudes

 Qual  Lon 8.0+ 7.5+ 7.0+ 6.5+ 6.0+ 5.0+

  70W 121E 161E 161E 169E 166E 121E 117E
  30E 121E 153E 125E 167E 166E 117E 116E
 121E 121E 153E 124E 161E 124E 117E 114E
  27E 117E 150E 123E 125E 123E  30E 114E
  71W  99E 150E 101E 124E 120E  22E 110E
 124E  34E 101E 101E 123E  22E  20E  26E
 117E  30E  97E  70E 122E  20E  63W  23E
  23E  27E  93E  68W 121E  10W  66W  23E
 121E  23E  92E  69W  68W  63W  66W  23E
  99E  22E  92E  70W  70W  70W  70W  23E
  70W  21E  68W  71W  70W  71W  70W  22E
  22E  14E  71W  74W  71W  71W  70W  61W
  34E  13E  74W  74W  73W  71W  71W  64W
  21E  70W  77W  76W  76W  71W  71W  65W
  72W  70W 103W  80W  77W  73W  73W  66W
  13E  71W 174W 101W  98W  74W  74W  71W
 121E  71W 174W 174W  98W  77W  98W  72W
 101W  72W 175W 174W 101W  98W  98W 154W
  14E 101W 175W 174W 157W 157W 157W 157W


 Line # 14   Line Date: 2018/12/29
 Table Longitudes

 Qual  Lon 8.0+ 7.5+ 7.0+ 6.5+ 6.0+ 5.0+

 117E 121E 161E 162E 161E 156E 159E 117E
  70W 121E 153E 161E 161E 155E 120E  26E
  27E 121E 153E 161E 160E 121E 117E  23E
  30E 121E 150E 149E 160E 121E 117E  23E
 121E 117E 150E 149E 159E 120E  27E  23E
  23E  99E 101E 125E 155E 110E  22E  23E
 124E  73E  97E 124E 125E  22E  63W  22E
 121E  70E  93E 123E 124E  20E  63W  21E
  71W  30E  92E 101E 123E  19W  66W  64W
  22E  27E  92E  70E 122E  21W  66W  65W
  73E  27E  68W  68W 121E  63W  66W  65W
  72W  23E  71W  71W  70E  68W  68W  65W
  70E  22E  74W  76W  21W  70W  70W  66W
  21E  21E  77W  80W  68W  71W  70W  67W
  70W  70W 103W 101W  70W  73W  70W  68W
 121E  70W 174W 148W  71W  74W  71W  68W
  27E  71W 174W 174W  73W  98W  74W  71W
 121E  71W 175W 174W  98W 102W 110W 153W
  99E  72W 175W 174W 157W 157W 157W 157W


 Line # 15   Line Date: 2018/12/19
 Table Longitudes

 Qual  Lon 8.0+ 7.5+ 7.0+ 6.5+ 6.0+ 5.0+

 117E 121E 161E 161E 167E 160E 159E 114E
  27E 121E 153E 161E 162E 156E 155E 112E
  23E 121E 153E 149E 161E 155E 121E  23E
 121E 121E 150E 149E 160E 121E 120E  22E
  70W 117E 150E 125E 159E 120E 117E  21E
  72W  73E 137E 124E 155E 110E 117E  21E
  30E  71E 101E 123E 123E  22E 110E  64W
  13E  70E  97E 101E 122E  20E  66E  65W
 121E  70E  93E 101E 121E  19W  27E  67W
  70W  30E  68W  70E  71E  63W  22E  67W
  70E  27E  70W  68W  70E  68W  63W  68W
 121E  27E  71W  71W  21W  70W  66W  68W
  73E  23E  74W  74W  68W  71W  66W  68W
  71E  22E  77W  80W  70W  71W  66W  69W
 125E  13E 103W 101W  70W  74W  70W  71W
  70E  70W 174W 148W  71W  77W  71W 153W
 121E  70W 174W 174W  73W  98W  74W 153W
  22E  71W 175W 174W  98W 112W 157W 154W
  27E  72W 175W 174W 157W 157W 157W 157W


 Line # 16   Line Date: 2018/12/09
 Table Longitudes

 Qual  Lon 8.0+ 7.5+ 7.0+ 6.5+ 6.0+ 5.0+

 117E 124E 161E 166E 162E 168E 160E 167E
  71W 121E 153E 166E 161E 161E 159E 166E
 121E 119E 153E 162E 160E 160E 159E 161E
  23E 117E 150E 161E 155E 156E 156E 160E
  27E  96E 150E 161E 126E 155E 155E 160E
  63W  75E 137E 152E 125E 125E 155E 160E
  70E  73E 101E 125E 123E 124E 120E 159E
  70W  70E  97E 124E 122E 122E 114E 159E
 101W  70E  97E 123E 121E 121E  80E 156E
  67E  67E  96E 120E  70E 120E  71E 119E
  75E  30E  93E 118E  39W 110E  66E  79E
  96E  27E  68W  70E  68W 102E  27E  71E
 119E  27E  71W  66E  70W  22E  63W  67E
  70E  23E  74W  68W  73W  68W  66W  27E
 125E  13E 174W  71W 101W  74W  66W  19W
 124E  63W 174W 101W 157W 111W  68W  65W
  13E  70W 175W 174W 174W 112W 111W  66W
  30E  71W 175W 174W 174W 153W 112W  71W
  27E 101W 178W 174W 174W 156W 157W 107W


 Line # 17   Line Date: 2018/11/29
 Table Longitudes

 Qual  Lon 8.0+ 7.5+ 7.0+ 6.5+ 6.0+ 5.0+

  69E 161E 161E 169E 161E 163E 179E 161E
   7W 122E 152E 166E 161E 160E 165E 160E
  23E 117E 150E 162E 160E 156E 163E 160E
 177E 115E 150E 161E 156E 156E 160E 158E
 122E  99E 137E 161E 155E 155E 159E 119E
  69E  99E  97E 161E  14W  69E 159E 117E
  70E  93E  97E 148E  17W  17W 158E 117E
 155W  76E  96E 124E  21W  21W 156E 116E
  76E  73E  93E  74E  39W  63W 156E 115E
 161E  71E  92E  66E  66W  66W  69E  70E
 117E  70E  92E  70W  68W  71W  27E  28E
  71E  69E  68W  70W  71W  71W  17W  27E
  99E  69E  71W  71W  83W  91W  21W  21W
   4E  27E  74W  71W 154W 111W  63W  22W
 115E  23E 174W 149W 155W 153W  66W  24W
  73E   4E 174W 174W 174W 154W  66W  63W
  93E   7W 175W 174W 174W 178W  67W  63W
  99E   7W 175W 174W 174W 179W 111W  64W
  27E 155W 178W 178W 179W 179W 153W 111W


 Line # 18   Line Date: 2018/11/19
 Table Longitudes

 Qual  Lon 8.0+ 7.5+ 7.0+ 6.5+ 6.0+ 5.0+

  27E 125E 161E 162E 162E 162E 156E 119E
  27E 121E 161E 161E 161E 156E 156E 119E
 117E 117E 161E 161E 160E 155E 155E 117E
 121E  71E 150E 161E 156E 152E 152E 115E
  30E  69E 150E 150E 155E 125E  66E 112E
 125E  61E 145E 150E 154E 121E  27E  67E
  69E  30E 118E 124E 123E 120E  22E  27E
  92W  27E 101E 123E 122E 110E  63W  24E
  72W  27E  93E 113E 121E  25E  63W  23E
  23E  23E  92E  70E  71E  22E  64W  21E
   7W  13E  92E  70W  21W  63W  66W  21E
   7W   4W  71W  71W  66W  64W  72W  66W
   4W   7W  72W  71W  68W  74W  74W  68W
  13E   7W  74W  97W  70W  91W  91W  68W
  71E  63W 174W 148W  70W  91W 111W  71W
  63W  71W 174W 149W  71W 111W 112W 112W
  73W  72W 175W 174W  73W 112W 153W 153W
  61E  73W 175W 174W 154W 153W 157W 154W
 177E  92W 178W 174W 157W 179W 179W 157W


 Line # 19   Line Date: 2018/11/09
 Table Longitudes

 Qual  Lon 8.0+ 7.5+ 7.0+ 6.5+ 6.0+ 5.0+

  27E 121E 161E 162E 179E 121E 121E 119E
  27E 121E 161E 161E 179E  88E 120E 117E
  30E 121E 161E 161E 178E  22E  30E 116E
 117E 117E 150E 149E 162E  22E  27E 115E
  92W  88E 150E 124E 155E  22E  22E 114E
  23E  30E 118E 123E 123E  63W  22E 113E
 121E  27E 101E 113E 122E  63W  63W 112E
  27E  27E  93E 101E 121E  64W  64W  24E
  70W  27E  92E  70E  88E  70W  65W  23E
  88E  27E  92E  70W  71E  71W  66W  21E
  23E  23E  71W  71W  70E  71W  66W  64W
  27E  23E  72W  71W  68W  74W  71W  67W
  72W  23E  74W  71W  70W  91W  71W  67W
 125E   2W 172W  80W  70W  91W  74W  68W
  23E  63W 174W 148W  70W  92W  91W  71W
 121E  70W 174W 149W  71W 153W  91W 152W
   2W  71W 175W 174W  93W 157W  92W 153W
 121E  72W 175W 174W  98W 162W 157W 154W
  63W  92W 178W 174W 157W 179W 179W 157W


 Line # 20   Line Date: 2018/10/30
 Table Longitudes

 Qual  Lon 8.0+ 7.5+ 7.0+ 6.5+ 6.0+ 5.0+

 121E 125E 161E 162E 178E 162E 152E 125E
  30E 121E 161E 161E 167E 155E 130E 124E
  92W 121E 161E 150E 162E 152E 130E 123E
  27E 117E 157E 150E 160E 140E 125E 122E
 125E 101E 150E 143E 155E 130E 124E 121E
  71W  61E 150E 131E 130E 130E 124E 120E
  72W  34E 118E 123E 126E 127E 121E 120E
  34E  30E 101E 121E 122E 126E 121E 120E
 121E  27E  93E 113E 121E 125E 120E 117E
 126E  27E  92E 101E  71E 122E  30E 112E
 117E  27E  92E 101E  39W 121E  27E  27E
   2W  15E  70W  70W  70W  22E  22E  20E
  62W   0E  71W  71W  73W  52W  52W  25W
   0E   2W  72W  80W  92W  64W  63W  62W
  15E  62W 172W 148W  93W  74W  78W  67W
  61E  71W 174W 149W  98W  74W  92W  70W
  27E  72W 174W 174W 148W  78W 157W  92W
 101E  73W 175W 174W 157W  92W 179W 151W
  73W  92W 175W 174W 179W 179W 179W 154W


 Line # 21   Line Date: 2018/10/20
 Table Longitudes

 Qual  Lon 8.0+ 7.5+ 7.0+ 6.5+ 6.0+ 5.0+

 126E 125E 161E 162E 162E 130E 156E 155E
  30E 125E 161E 161E 155E 126E 156E 124E
  27E 121E 161E 154E 154E 125E 152E 123E
  71W 121E 150E 150E 150E 123E 130E 122E
  69E 118E 150E 150E 150E 121E 126E 121E
 121E 117E 118E 145E 130E  25E 124E 118E
 125E 101E 101E 143E 126E  22E 122E 118E
  73W  69E  97E 123E 122E  63W 120E 117E
 101E  34E  93E 113E 121E  64W  35E 115E
 121E  30E  92E  70W 121E  67W  30E  27E
  34E  27E  92E  71W  93E  70W  63W  27E
   4W  27E  70W  71W   1E  72W  70W  26E
  15E  15E  71W  97W  14W  73W  72W  63W
   1W   1W  72W 148W  14W  74W  72W  64W
  92W   4W 174W 149W  53W  86W  86W  64W
 125E  71W 174W 174W  70W 154W 150W  68W
 118E  71W 175W 174W  71W 162W 157W  75W
  71W  73W 175W 174W  73W 179W 162W 151W
 117E  92W 178W 177W 154W 179W 179W 179W


 Line # 22   Line Date: 2018/10/10
 Table Longitudes

 Qual  Lon 8.0+ 7.5+ 7.0+ 6.5+ 6.0+ 5.0+

 126E 126E 161E 169E 155E 130E 177E 155E
  27E 125E 161E 162E 154E 126E 156E 124E
  30E 125E 150E 161E 150E 123E 156E 124E
 121E 121E 150E 161E 150E 121E 152E 123E
 121E 121E 145E 150E 130E 121E 130E 122E
   1W 118E 118E 150E 126E 121E 126E 121E
  69E 101E 101E 145E 122E  88E 124E 121E
 101E  93E  97E 143E 121E  25E 124E 118E
  71W  69E  93E 131E 121E  63W 122E 118E
 125E  34E  92E 123E  93E  64W 120E 117E
  73W  30E  92E  70W   1E  67W  35E 115E
   4W  27E  70W  71W  14W  70W  28E  27E
   1E  27E  71W  71W  14W  71W  25E  27E
 125E  15E  72W 148W  53W  72W  25W  63W
 118E   1E 174W 149W  70W  86W  63W  64W
  34E   1W 174W 174W  71W 154W  69W  64W
  15E   4W 175W 174W  73W 162W  86W 151W
 140E  71W 175W 174W 154W 179W 150W 178W
  93E  73W 178W 177W 179W 179W 162W 179W


 Line # 23   Line Date: 2018/09/30
 Table Longitudes

 Qual  Lon 8.0+ 7.5+ 7.0+ 6.5+ 6.0+ 5.0+

   1W 140E 161E 172E 150E 141E 142E 178E
 126E 126E 161E 169E 150E 126E 124E 124E
 101E 125E 150E 150E 143E 125E 124E 123E
 140E 121E 150E 150E 142E 121E 122E 123E
   1E 118E 145E 145E 130E 104E 120E 121E
 125E 101E 118E 143E 126E  88E  88E 121E
 121E 101E 101E 131E 121E  25E  35E 121E
 140E  99E  93E  70W  93E   1E  72W 121E
   4W  93E  92E  71W   1E  63W  85W 118E
  83W  51E  92E  71W  14W  71W  86W 118E
 118E  33E  71W  97W  14W  76W  92W  94E
  51E  27E  72W 148W  53W  76W  93W  61W
  73W  15E 172W 149W  70W  86W 150W  61W
  93E  13E 174W 174W  71W 154W 173W 148W
  33E   1E 174W 174W  71W 162W 173W 151W
  15E   1W 175W 174W  73W 173W 174W 175W
 101E   4W 175W 175W 154W 176W 178W 178W
  99E  73W 176W 175W 177W 177W 178W 179W
  13E  83W 178W 177W 179W 179W 179W 179W


 Line # 24   Line Date: 2018/09/20
 Table Longitudes

 Qual  Lon 8.0+ 7.5+ 7.0+ 6.5+ 6.0+ 5.0+

   1W 140E 161E 172E 150E 141E 177E 179E
 101E 126E 150E 169E 150E 126E 142E 178E
 121E 125E 150E 150E 143E 121E 124E 123E
 126E 121E 145E 150E 130E 121E 122E 122E
 140E 118E 118E 145E 126E 104E 101E 118E
   4W 104E 101E 143E  93E  88E  96E  94E
   1E 101E  93E 131E   1E  25E  35E  88E
  83W 101E  92E  94E  14W   1E  71W  75W
  13E 100E  92E  70W  14W  63W  72W  75W
 140E  93E  71W  71W  53W  71W  80W 151W
 101E  51E  72W  71W  70W  76W  86W 175W
 100E  27E  74W 148W  71W  76W  93W 175W
  73W  15E 172W 149W  71W  83W 150W 178W
 104E  13E 174W 174W  73W  86W 173W 178W
 125E   1E 174W 174W 154W 173W 174W 178W
 118E   1W 175W 174W 175W 176W 176W 179W
  93E   4W 175W 175W 175W 177W 178W 179W
  51E  73W 176W 175W 177W 179W 178W 179W
  15E  83W 178W 177W 179W 179W 179W 180W


 Line # 25   Line Date: 2018/09/10
 Table Longitudes

 Qual  Lon 8.0+ 7.5+ 7.0+ 6.5+ 6.0+ 5.0+

   1W 140E 161E 179E 150E 150E 147E 179E
 125E 140E 161E 172E 150E 149E 143E 179E
 126E 138E 153E 169E 143E 147E 142E 178E
 101E 126E 150E 150E 143E 145E 141E 178E
   4W 125E 150E 150E 142E 144E 126E 177E
   4W 121E 147E 145E 130E 141E 126E 146E
 140E 118E 144E 143E 126E 128E 125E 124E
  99E 101E 144E 131E  93E 126E 124E 123E
   1E  99E 118E  94E   1E 125E 122E  94E
 121E  93E 101E  70W  14W  88E  96E  89E
  83W  51E  92E  71W  53W  76W  88E  88E
 177E  27E  92E  71W  70W  76W  35E  75W
  93E  15E  72W  85W  71W  86W  39W  91W
 118E   1E 174W  97W  71W 162W  85W  92W
 138E   1W 174W 148W  73W 173W  87W 175W
 140E   4W 175W 175W  93W 176W 150W 178W
  51E   4W 175W 175W 154W 176W 175W 178W
  15E  73W 176W 176W 177W 177W 178W 179W
  73W  83W 178W 177W 179W 179W 178W 179W


 Line # 26   Line Date: 2018/08/31
 Table Longitudes

 Qual  Lon 8.0+ 7.5+ 7.0+ 6.5+ 6.0+ 5.0+

  15E 140E 161E 150E 168E 148E 147E 148E
 104E 126E 161E 150E 150E 148E 146E 148E
 121E 121E 153E 149E 150E 147E 145E 147E
 126E 119E 153E 149E 146E 146E 144E 145E
  27E 110E 150E 147E 145E 145E 144E 145E
  13E 104E 150E 146E 144E 144E 143E 144E
 143E 102E 147E 145E 143E 143E 142E 144E
 122W 101E 144E 144E 143E 143E 142E 144E
  73W 100E 144E 144E 140E 142E 142E 144E
 102E  93E 142E 144E 130E 141E 126E 143E
 140E  51E 101E 143E 126E 126E 121E 142E
 100E  32E  92E 131E 126E 121E 107E 141E
  93E  27E  92E 102E 121E 104E 104E 124E
  32E  16E  72W 101E  93E  58E 101E 107E
  16E  15E 172W  85W  73W  55E  15E  56E
  51E  13E 174W  97W  77W  15E  35W  54E
  89W  73W 174W 148W  78W  72W  39W  78W
 110E  89W 175W 175W  85W  73W  78W 122W
 119E 122W 175W 175W 148W 130W 122W 164W
This is the best place on this Web page to begin studying the above Table Data. Just scroll upwards and watch the number of 71 W entries in each of the (Table 1) "Summary" tables as they change.Data Line Dates on the above Year ChartThe above list shows that the 71 W longitude entries are good matches for the corresponding line peaks on the Year Chart. However, those chart line peaks do not presently provide any information regarding the number of earthquakes in some longitude area actually matched the Averaged EM Signal data line being examined.
Line Date Number of 71 W area entries for the Line Date
2019/02/17 3 2019/02/07 6 2019/01/28 9 2019/01/20 date of the earthquake (there is no table for that date) 2019/01/18 11 2019/01/08 27 2018/12/29 20 2018/12/19 19 2018/12/09 8 2018/11/29 8 2018/11/19 13 2018/11/09 21 2018/10/30 11 2018/10/20 16 2018/10/10 13 2018/09/30 10 2018/09/20 11 2018/09/10 7 2018/08/31 2
Return To The Earthquake Research Homepage
The first version of this Web page was
stored at this site on
December 19, 2019. Comments regarding this Web site are
welcome.
Please send them to:
webmaster@earthquake-research.com
The information on this Web page represents expression
of personal opinion by the Web page author.
The address -URL- for this Web page is:
http://www.earthquake-research.com/eqf/Table-Data.html