Individaul Electromagnetic Signal Tables

INDIVIDUAL  ELECTROMAGNETIC  (EM)  SIGNAL  TABLES

Latest Update:  December 19, 2019

A Web page display Zoom setting of 125% or 150% can make this Web page's text and table data easier to read.

This Web page is presently undergoing a major update.

The present version of this Web page is intended largely for demonstration purposes.
The next update will contain the latest actual data.


       Earthquake forecasters and researchers who do not already have a good understanding of the Table Data on this Web page should review the explanation information in the the Individual EM Signals section of the Table-Data Web page.

       The Table Data are table types of representations of the Individual EM Signal chart lines that can be found on the EMS.png and EQ-EMS.png charts displayed on the Data.html Web page.  Those charts and these tables are intended to help earthquake forecasters and researchers identify patterns in the data that might enable them to determine when Significant Earthquakes are approaching for locations that are of interest to them.

       This Web page's Table Data can be compared with similar data for Significant Earthquakes that can be found on the Significant-Earthquakes.html Web page.  The earthquakes on that Web page go from the present back to the start of 1973.  Most of those earthquakes resulted in fatalities.  Also on that Web page are 8.0 and higher magnitude earthquakes going back to the start of 1973 plus a number of additional earthquakes that are important for research purposes.

       See also the Earthquake-Forecasting-Procedures.html Web page, the Data.html Web page, the Earthquake Forecasting Breakthroughs Web page, and the Table-Data Web page.

       The following section related to the devastating January 12, 2010 Haiti earthquake is an example of how the Table Data for Individual EM Signals can be helpful to earthquake forecasters as they attempt to determine when and where an expected earthquake might be about to occur.  This matter is discussed in much more detail on the Table-Data Web page.

THE  ABSOLUTELY  CATASTROPHIC  JANUARY 12, 2010  HAITI  EARTHQUAKE

2010/01/12 21:53:10 18.44N  72.57W  13 7.0 "Haiti region"

       That calamitous earthquake reportedly resulted in the loss of more than 200,000 lives!  One survivor's personal account of the disaster can be found on the Earthquake Forecasting Breakthroughs Web page.

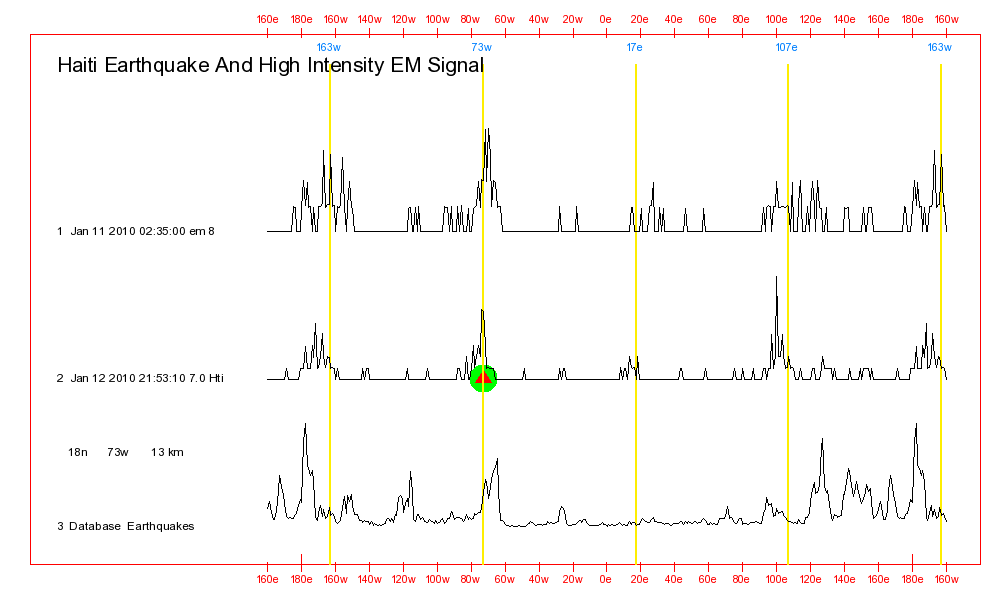
       The chart below displays the data line shape for the especially high intensity EM 8 Signal that was detected a little more than 35 hours before that catastrophic earthquake.  EM 9 signals are the strongest signal that can be detected.  They are detected only a few times a year at most.  The somewhat less intense EM 8 signals such as the one on the chart might be detected once every few months.

       The data line shape for the Haiti earthquake can be seen just below the data line for the EM 8 Signal.

       Those two data lines are quite similar in shape.  That indicates that the EM Signal was likely associated with the approach of the following day's Haiti earthquake.  And as can be seen, one of the main line peaks for the EM Signal data line was located right around 73 W where the earthquake eventually occurred.

       That especially high intensity EM Signal data line was likely accurately indicating that a Significant Earthquake might be about to occur in some fault zone along the 73 W longitude line.

Haiti Research 2

       The line peak heights on Data Line # 3 provide information regarding how many of the more than 110,000 earthquakes in the earthquake database file going back to the beginning of 1973 occurred at various longitudes.  That information is important when the longitudes of the line peaks on EM Signal and earthquake data lines are being studied.  The computer program that generates these charts and tables preferentially draws line peaks at longitudes where large numbers of earthquakes occurred in the past.

       Data Tables such as the ones below for Individual EM Signals such as the one on the above chart can be helpful for determining exactly where a chart line peak might be pointing.  At times the longitudes of the chart line peaks might be off a bit from the longitude of the expected earthquake.

THE  HIGH  INTENSITY  EM  8  EM  SIGNAL  TABLE  DATA

       The first horizontal group of tables below are for that high intensity EM Signal.
Table 1                                      Table 2                                                Table 3                                                Table 4                                                Table 5                                                Table 6                                                Table 7                                                Table 8                                                Table 9

EM Signal Date:  2010/01/11                  EM Signal Date:  2010/01/11                            EM Signal Date:  2010/01/11                            EM Signal Date:  2010/01/11                            EM Signal Date:  2010/01/11                            EM Signal Date:  2010/01/11                            EM Signal Date:  2010/01/11                            EM Signal Date:  2010/01/11                            EM Signal Date:  2010/01/11
Strength:        8                           Strength:        8                                     Strength:        8                                     Strength:        8                                     Strength:        8                                     Strength:        8                                     Strength:        8                                     Strength:        8                                     Strength:        8
                                             
Table Longitudes from tables 2 through 9                  Destructive Matches - Quality Sort                     Destructive Matches - Longitude Sort                   8.0+ Mag - Longitude Sort                              7.5+ Mag - Longitude Sort                              7.0+ Mag - Longitude Sort                              6.5+ Mag - Longitude Sort                              6.0+ Mag - Longitude Sort                              5.0+ Mag - Longitude Sort
                                                 
 Qual  Lon 8.0+ 7.5+ 7.0+ 6.5+ 6.0+ 5.0+     Pa  Pd  D#   Earthquake UTC Date Lat Lon Depth Mag     Pa  Pd  D#   Earthquake UTC Date Lat Lon Depth Mag     Pa  Pd  D#   Earthquake UTC Date Lat Lon Depth Mag     Pa  Pd  D#   Earthquake UTC Date Lat Lon Depth Mag     Pa  Pd  D#   Earthquake UTC Date Lat Lon Depth Mag     Pa  Pd  D#   Earthquake UTC Date Lat Lon Depth Mag     Pa  Pd  D#   Earthquake UTC Date Lat Lon Depth Mag     Pa  Pd  D#   Earthquake UTC Date Lat Lon Depth Mag     
  77W 140E 165E 179E 179E 179E 179E 124E      84 100   1  1993/04/18 09:16:23 12S  77W  106 6.3      71  85   1  1987/12/17 02:08:19 35N 140E   63 6.7      24  28   2  2013/02/06 01:12:25 11S 165E   24 8.0      80          2014/06/23 20:53:09 52N 179E  107 7.9      80          2014/06/23 20:53:09 52N 179E  107 7.9      80          2014/06/23 20:53:09 52N 179E  107 7.9      80          2014/06/23 20:53:09 52N 179E  107 7.9      90          2002/02/08 09:01:47 12S 124E   33 5.1     
  73W 126E 161E 154E 166E 156E 156E 114E      82  99   1  1994/03/02 03:38:03 20N  73W   59 5.4      73  88   1  1975/10/31 08:28:02 13N 126E   50 7.2      29          2004/12/23 14:59:04 49S 161E   10 8.1      60          1995/08/16 10:27:28  6S 154E   30 7.8      73          2013/02/06 01:54:15 10S 166E   10 7.0      75          1974/05/15 18:59:57 50N 156E   58 6.5      85          2006/08/20 03:01:02 50N 156E   26 6.0      92          1994/06/03 13:39:24  9S 114E   33 5.4     
  73W 104E 150E 150E 154E 145E 123E 113E      80  96   6  2010/01/12 21:53:10 18N  73W   13 7.0      77  92   2  1976/08/23 03:30:07 32N 104E   33 6.7      72          1998/03/25 03:12:25 63S 150E   10 8.8      72          1998/03/25 03:12:25 63S 150E   10 8.8      71          2008/11/24 09:02:58 54N 154E  492 7.3      74          2012/08/14 02:59:42 50N 145E  625 7.7      80          1985/08/04 02:36:23  7N 123E   22 6.4      99          2001/01/19 20:26:41  9S 113E  112 5.2     
  69E 101E 150E 150E 150E 130E 120E 106E      78  93   2  1999/02/11 14:08:51 34N  69E   33 6.0      68  81   3  1981/01/23 21:13:51 31N 101E   33 6.8      72          1998/03/25 03:12:25 63S 150E   10 8.1      72          1998/03/25 03:12:25 63S 150E   10 8.1      72          1998/03/25 03:12:25 63S 150E   10 8.8      77          1992/12/20 20:52:47  7S 130E   77 7.0      84          1996/02/07 07:57:18  1N 120E   13 6.1      93          2019/07/28 14:25:02  7S 106E   53 5.1     
  71W 101E 101E 145E 150E 104E 100E 104E      78  93   1  1987/08/13 15:23:06 18S  71W   37 6.6      75  90   2  1979/03/15 12:52:29 23N 101E   33 6.2      60  72   2  2007/09/12 11:10:26  4S 101E   34 8.4      74          2012/08/14 02:59:42 50N 145E  625 7.7      72          1998/03/25 03:12:25 63S 150E   10 8.1      77  92   2  1976/08/23 03:30:07 32N 104E   33 6.7      82          2008/03/03 02:37:27  2S 100E   25 6.1      89          1974/06/15 07:15:54 28N 104E   33 5.1     
  27E  95E  93E 136E 145E  98E  98E  95E      77  92   1  1988/01/05 06:41:16 27S  27E    5 5.2      76  91   1  2006/12/17 21:10:21  5N  95E   36 5.8      22  26   1  2012/04/11 08:38:36  2N  93E   20 8.6      51  61   2  1979/09/12 05:17:51  2S 136E    5 7.9      74          2012/08/14 02:59:42 50N 145E  625 7.7      79          1984/11/17 06:49:30  0N  98E   28 7.1      79          1984/11/17 06:49:30  0N  98E   28 7.1      91          2016/10/26 02:21:59 23N  95E  110 5.0     
 104E  95E  92E 101E 143E  95E  20E  26E      77  92   2  1976/08/23 03:30:07 32N 104E   33 6.7      74  88   2  1988/08/06 00:36:24 25N  95E   91 7.3      50          2012/04/11 10:43:10  1N  92E   25 8.2      58          2007/09/12 23:49:04  3S 101E   30 7.9      68          1992/07/18 08:36:58 39N 143E   28 7.0      74  88   2  1988/08/06 00:36:24 25N  95E   91 7.3      83          2014/01/26 13:55:42 38N  20E    8 6.1      91          1981/12/21 14:15:43 39N  26E   15 5.0     
  95E  92E  92E 101E 130E  63E  64W  64W      76  91   1  2006/12/17 21:10:21  5N  95E   36 5.8      67  80   1  1988/02/06 14:50:45 25N  92E   33 5.9      50          2012/04/11 10:43:10  1N  92E   25 8.2      60  72   2  2007/09/12 11:10:26  4S 101E   34 8.4      77          1992/12/20 20:52:47  7S 130E   77 7.0      75          1976/05/17 02:58:40 40N  63E   15 6.7      90          2017/02/21 14:09:04 19S  64W  598 6.5      90          2017/02/21 14:09:04 19S  64W  598 6.5     
 101E  69E  68W  94E 126E  63E  70W  67W      75  90   2  1979/03/15 12:52:29 23N 101E   33 6.2      78  93   2  1999/02/11 14:08:51 34N  69E   33 6.0      21  25   1  1994/06/09 00:33:16 14S  68W  631 8.2      56          2016/03/02 12:49:48  5S  94E   24 7.8      73  88   1  1975/10/31 08:28:02 13N 126E   50 7.2      75  89   1  1976/05/17 02:58:40 40N  63E   10 7.0      89          1988/02/05 14:01:04 25S  70W   37 7.2      93          1988/11/03 19:42:20 19N  67W   41 5.9     
  63E  63E  70W  92E 121E  58E  71W  69W      75  89   1  1976/05/17 02:58:40 40N  63E   10 7.0      75  89   1  1976/05/17 02:58:40 40N  63E   10 7.0      16  20   1  1995/07/30 05:11:23 23S  70W   46 8.0      50          2012/04/11 10:43:10  1N  92E   25 8.2      63          1978/07/23 14:42:41 22N 121E   38 7.3      74          1983/04/08 02:28:28 11N  58E   15 6.5      83          1984/02/26 08:18:20 17S  71W  109 6.0      90          1975/06/05 20:29:40 16S  69W  210 5.5     
  95E  27E  71W  92E  98E  63W  72W  72W      74  88   2  1988/08/06 00:36:24 25N  95E   91 7.3      77  92   1  1988/01/05 06:41:16 27S  27E    5 5.2      22  26   1  2014/04/01 23:46:47 20S  71W   25 8.2      50          2012/04/11 10:43:10  1N  92E   25 8.2      79          1984/11/17 06:49:30  0N  98E   28 7.1      79          2018/04/02 13:40:34 21S  63W  559 6.8      91          2010/03/11 15:06:04 34S  72W   32 6.0      91          2010/03/11 15:06:04 34S  72W   32 6.0     
  93W  15E  74W  70W  95E  64W  72W  72W      73  88   1  1993/09/10 19:12:54 15N  93W   34 7.2      70  84   4  1980/11/23 18:34:53 41N  15E   10 6.9      40  48   3  2001/06/23 20:33:14 16S  74W   33 8.4      47  57   1  1987/03/05 09:17:05 24S  70W   62 7.6      74  88   2  1988/08/06 00:36:24 25N  95E   91 7.3      90          2017/02/21 14:09:04 19S  64W  598 6.5      87          2010/03/11 14:55:28 34S  72W   18 6.7      93          1985/06/13 01:58:09 37S  72W   55 5.0     
 126E  13E  75W  71W  63E  70W  73W  73W      73  88   1  1975/10/31 08:28:02 13N 126E   50 7.2      67  80   1  1998/03/26 16:26:11 43N  13E   10 5.4      20          2019/05/26 07:41:15  6S  75W  123 8.0      59          2015/11/24 22:50:53 10S  71W  612 7.6      75  89   1  1976/05/17 02:58:40 40N  63E   10 7.0      89          1988/02/05 14:01:04 25S  70W   37 7.2      80  96   6  2010/01/12 21:53:10 18N  73W   13 7.0      92          1979/05/21 20:21:40  7N  73W   45 5.2     
 140E  64W  77W  71W  70W  71W  77W  74W      71  85   1  1987/12/17 02:08:19 35N 140E   63 6.7      65  78   1  1985/03/19 10:28:36 19S  64W   33 5.8      17  21   3  2007/08/15 23:40:57 13S  77W   39 8.0      58          2015/11/24 22:45:38 11S  71W  601 7.6      89          1988/02/05 14:01:04 25S  70W   37 7.2      78  93   1  1987/08/13 15:23:06 18S  71W   37 6.6      84 100   1  1993/04/18 09:16:23 12S  77W  106 6.3      92          1991/07/29 13:52:39 14S  74W   96 5.5     
  15E  71W 172W  80W  73W  72W  82W  76W      70  84   4  1980/11/23 18:34:53 41N  15E   10 6.9      78  93   1  1987/08/13 15:23:06 18S  71W   37 6.6      29  35   2  2009/09/29 17:48:10 15S 172W   18 8.1      62  74   1  1996/02/21 12:51:01 10S  80W   10 7.5      80  96   6  2010/01/12 21:53:10 18N  73W   13 7.0      87          2010/03/11 14:55:28 34S  72W   18 6.7      83          1999/12/01 19:23:06 18N  82W   10 6.3      90          1999/10/04 13:57:38 11S  76W   33 5.6     
  97W  73W 174W  97W  93W  72W  86W  77W      68  82   2  1999/09/30 16:31:15 16N  97W   61 7.5      80  96   6  2010/01/12 21:53:10 18N  73W   13 7.0      45          2006/05/03 15:26:40 20S 174W   55 8.0      68  82   2  1999/09/30 16:31:15 16N  97W   61 7.5      66          1995/10/21 02:38:57 17N  93W  159 7.2      78          1985/03/19 04:01:09 33S  72W   46 6.7      91          2005/07/02 02:16:46 11N  86W   45 6.7      93          1973/01/30 15:03:23 46S  77W   33 5.3     
 101E  73W 174W 103W  93W  73W 162W  86W      68  81   3  1981/01/23 21:13:51 31N 101E   33 6.8      82  99   1  1994/03/02 03:38:03 20N  73W   59 5.4      42          1995/04/07 22:06:56 15S 174W   21 8.1      64  76   2  1973/01/30 21:01:12 18N 103W   43 7.5      73  88   1  1993/09/10 19:12:54 15N  93W   34 7.2      80  96   6  2010/01/12 21:53:10 18N  73W   13 7.0      83          1991/05/30 13:17:41 55N 162W   28 6.8      91          2005/07/02 02:16:46 11N  86W   45 6.7     
  13E  77W 175W 148W  97W  86W 172W 168W      67  80   1  1998/03/26 16:26:11 43N  13E   10 5.4      84 100   1  1993/04/18 09:16:23 12S  77W  106 6.3      54          1986/05/07 22:47:10 52N 175W   20 8.0      56          2002/11/03 22:12:41 64N 148W    5 7.9      68  82   2  1999/09/30 16:31:15 16N  97W   61 7.5      91          2005/07/02 02:16:46 11N  86W   45 6.7      82          2008/12/24 09:11:34 17S 172W    9 6.0     100          1974/01/19 08:53:39 53N 168W   59 5.0     
  92E  93W 175W 175W 102W 162W 177W 178W      67  80   1  1988/02/06 14:50:45 25N  92E   33 5.9      73  88   1  1993/09/10 19:12:54 15N  93W   34 7.2      54          1986/05/07 22:47:10 52N 175W   33 8.0      54          1986/05/07 22:47:10 52N 175W   20 8.0      64  77   1  1981/10/25 03:22:15 18N 102W   33 7.3      83          1991/05/30 13:17:41 55N 162W   28 6.8      82          1998/11/15 02:44:12 22S 177W  149 6.3      91          1984/05/25 07:57:47 30S 178W   33 5.1     
        Table 1 in the above 9 horizontal groups of tables provides a quick summary of how many earthquakes occurred in the past at around 73 W longitude where the Haiti earthquake occurred.  The matching 73 W entries are highlighted in bold text.

        Ordinarily there might be three to five 73 W area longitude entries in that table.  But there are 19 of them if ones for the earthquake itself are not counted.

       That unusually large number of earthquake longitude entries in Table 1 was likely an accurate and timely indicator that the Haiti earthquake was approaching.  Additionally, the following earthquake is the second best match for that EM 8 Signal with past deadly earthquakes.  That match was selected from the 800 or so deadly ones that are listed in the earthquake database file being used by the computer program that generates these charts and tables.
1994/03/02 03:38:03 20N  73W   59 5.4
       That is almost an exact match for the latitude and longitude where the Haiti earthquake occurred.  The depth and magnitude are quite different for the two earthquakes.
2010/01/12 21:53:10 18N  73W   13 7.0
       Finally, the Haiti earthquake itself is listed as a high quality match for the EM 8 Signal in all of the tables where it could appear except for the 5 and higher magnitude table - Table 9.  That is another indicator that the computer program was able to accurately match the earthquake and the EM Signal.  The Haiti earthquake itself could not appear in the 7.5 and 8.0 and higher magnitude tables because its magnitude was only 7.0.

THE  HAITI  EARTHQUAKE  TABLE  DATA

       The group of tables below are for that destructive Haiti earthquake.
Table 1                                      Table 2                                                Table 3                                                Table 4                                                Table 5                                                Table 6                                                Table 7                                                Table 8                                                Table 9

Earthquake   2010/01/12 21:53:10 18.44N  72.57W  13 7.0 "Haiti region"
Fatalities   250000                                             

Earthquake 2010/01/12 21:53:10 18N 73W 13 7  Earthquake   2010/01/12 21:53:10 18N 73W 13 7          Earthquake   2010/01/12 21:53:10 18N 73W 13 7          Earthquake   2010/01/12 21:53:10 18N 73W 13 7          Earthquake   2010/01/12 21:53:10 18N 73W 13 7          Earthquake   2010/01/12 21:53:10 18N 73W 13 7          Earthquake   2010/01/12 21:53:10 18N 73W 13 7          Earthquake   2010/01/12 21:53:10 18N 73W 13 7          Earthquake   2010/01/12 21:53:10 18N 73W 13 7          
Table Longitudes from tables 2 through 9                  Destructive Matches - Quality Sort                     Destructive Matches - Longitude Sort                   8.0+ Mag - Longitude Sort                              7.5+ Mag - Longitude Sort                              7.0+ Mag - Longitude Sort                              6.5+ Mag - Longitude Sort                              6.0+ Mag - Longitude Sort                              5.0+ Mag - Longitude Sort
                                                 
 Qual  Lon 8.0+ 7.5+ 7.0+ 6.5+ 6.0+ 5.0+     Pa  Pd  D#   Earthquake UTC Date Lat Lon Depth Mag     Pa  Pd  D#   Earthquake UTC Date Lat Lon Depth Mag     Pa  Pd  D#   Earthquake UTC Date Lat Lon Depth Mag     Pa  Pd  D#   Earthquake UTC Date Lat Lon Depth Mag     Pa  Pd  D#   Earthquake UTC Date Lat Lon Depth Mag     Pa  Pd  D#   Earthquake UTC Date Lat Lon Depth Mag     Pa  Pd  D#   Earthquake UTC Date Lat Lon Depth Mag     Pa  Pd  D#   Earthquake UTC Date Lat Lon Depth Mag     
 104E 140E 165E 179E 179E 179E 179E 104E     100 100   2  1976/08/23 03:30:07 32N 104E   33 6.7      75  75   1  1987/12/17 02:08:19 35N 140E   63 6.7      20  20   2  2013/02/06 01:12:25 11S 165E   24 8.0      86          2014/06/23 20:53:09 52N 179E  107 7.9      86          2014/06/23 20:53:09 52N 179E  107 7.9      86          2014/06/23 20:53:09 52N 179E  107 7.9      86          2014/06/23 20:53:09 52N 179E  107 7.9     100 100   2  1976/08/23 03:30:07 32N 104E   33 6.7     
  73W 126E 161E 154E 178E 154E 130E 103E      94  94   6  2010/01/12 21:53:10 18N  73W   13 7.0      84  84   1  1975/10/31 08:28:02 13N 126E   50 7.2      40          2004/12/23 14:59:04 49S 161E   10 8.1      56          1995/08/16 10:27:28  6S 154E   30 7.8      74          2003/03/17 16:36:17 51N 178E   33 7.4      79          2008/11/24 09:02:58 54N 154E  492 7.3      84          1992/12/20 20:52:47  7S 130E   77 7.0      92          2008/04/02 08:48:49  4S 103E   67 5.8     
  77W 110E 150E 153E 166E 150E 127E 101E      88  88   1  1993/04/18 09:16:23 12S  77W  106 6.3      87  87   4  2006/05/26 22:53:58  8S 110E   13 6.3      78          1998/03/25 03:12:25 63S 150E   10 8.8      50          2019/05/14 12:58:26  4S 153E   10 7.5      76          2013/02/06 01:54:15 10S 166E   10 7.0      82          1998/03/25 03:12:25 63S 150E   10 8.1      86          1976/06/26 10:30:56  4N 127E    7 6.5      95          1994/08/05 03:39:05  3S 101E   68 5.5     
  95E 104E 150E 150E 154E 146E 110E 100E      87  87   1  2006/12/17 21:10:21  5N  95E   36 5.8     100 100   2  1976/08/23 03:30:07 32N 104E   33 6.7      82          1998/03/25 03:12:25 63S 150E   10 8.1      78          1998/03/25 03:12:25 63S 150E   10 8.8      79          2008/11/24 09:02:58 54N 154E  492 7.3      81          1993/10/13 03:07:30  6S 146E   33 6.7      87  87   4  2006/05/26 22:53:58  8S 110E   13 6.3      99          2019/02/02 09:58:11  3S 100E   10 5.3     
 110E 102E 145E 150E 150E 142E 107E 100E      87  87   4  2006/05/26 22:53:58  8S 110E   13 6.3      85  85   2  1995/10/23 22:46:50 26N 102E   10 6.2      19          1993/08/08 08:34:24 13N 145E   59 8.2      82          1998/03/25 03:12:25 63S 150E   10 8.1      78          1998/03/25 03:12:25 63S 150E   10 8.8      79          1996/02/16 15:22:58 37N 142E   40 6.7      91          1996/12/09 03:54:16  8S 107E   50 6.1      92          2009/08/16 20:23:43  1S 100E   23 5.2     
 102E 101E 101E 145E 150E 130E 106E 100E      85  85   2  1995/10/23 22:46:50 26N 102E   10 6.2      83  83   2  1979/03/15 12:52:29 23N 101E   33 6.2      71  71   2  2007/09/12 11:10:26  4S 101E   34 8.4      73          2012/08/14 02:59:42 50N 145E  625 7.7      82          1998/03/25 03:12:25 63S 150E   10 8.1      84          1992/12/20 20:52:47  7S 130E   77 7.0      87          2000/10/25 09:32:23  7S 106E   38 6.8      92          2005/08/30 20:59:08  2S 100E   29 5.2     
 126E  95E  97E 143E 130E 127E 104E 100E      84  84   1  1975/10/31 08:28:02 13N 126E   50 7.2      87  87   1  2006/12/17 21:10:21  5N  95E   36 5.8      15          2000/06/18 14:44:13 14S  97E   10 8.0      49          2002/09/08 18:44:26  3S 143E   33 7.5      84          1992/12/20 20:52:47  7S 130E   77 7.0      84          2014/11/21 10:10:19  2N 127E   38 6.5     100 100   2  1976/08/23 03:30:07 32N 104E   33 6.7      92          1993/07/17 09:46:34 28N 100E   30 5.8     
 101E  44E  93E 131E 126E 127E 102E 100E      83  83   2  1979/03/15 12:52:29 23N 101E   33 6.2      80  80   2  2004/07/01 22:30:09 40N  44E    5 5.1      20  20   1  2012/04/11 08:38:36  2N  93E   20 8.6      61          1973/09/29 00:44:01 42N 131E  570 7.8      84  84   1  1975/10/31 08:28:02 13N 126E   50 7.2      86          1976/06/26 10:30:56  4N 127E    7 6.5      85  85   2  1995/10/23 22:46:50 26N 102E   10 6.2      97          1989/05/03 15:41:32 30N 100E    3 5.6     
  38E  38E  92E 101E 101E 126E  99E  99E      83  83   1  1986/06/06 10:39:46 38N  38E   10 5.8      83  83   1  1986/06/06 10:39:46 38N  38E   10 5.8      43          2012/04/11 10:43:10  1N  92E   25 8.2      76          2007/09/12 23:49:04  3S 101E   30 7.9      76          2007/09/12 23:49:04  3S 101E   30 7.9      84  84   1  1975/10/31 08:28:02 13N 126E   50 7.2      88          2009/08/16 07:38:21  1S  99E   20 6.6      92          2009/08/18 09:28:59  1S  99E   35 5.1     
  64W  35E  92E 101E  98E 106E  58E  13E      80  80   1  1985/03/19 10:28:36 19S  64W   33 5.8      74  74   1  1995/11/22 04:15:11 29N  35E   10 7.2      47          2012/04/11 10:43:10  1N  92E   25 8.2      71  71   2  2007/09/12 11:10:26  4S 101E   34 8.4      78          1984/11/17 06:49:30  0N  98E   28 7.1      87          2000/10/25 09:32:23  7S 106E   38 6.8      85          1995/05/26 03:11:17 12N  58E   62 6.5      95          1976/02/27 09:58:47 46N  13E   33 5.2     
  44E  20E  71W  92E  35E 104E  68W  72W      80  80   2  2004/07/01 22:30:09 40N  44E    5 5.1      75  75   1  1982/11/16 23:41:21 41N  20E   21 5.6      18  18   1  2014/04/01 23:46:47 20S  71W   25 8.2      47          2012/04/11 10:43:10  1N  92E   25 8.2      74  74   1  1995/11/22 04:15:11 29N  35E   10 7.2     100 100   2  1976/08/23 03:30:07 32N 104E   33 6.7      87          2001/06/19 09:32:24 23S  68W  146 6.0      92          1993/07/16 21:21:26 33S  72W   30 5.7     
  13E  13E  72W  80W  73W  99E  72W  73W      80  80   1  1998/03/26 16:26:11 43N  13E   10 5.4      80  80   1  1998/03/26 16:26:11 43N  13E   10 5.4      16  16   3  1985/03/03 22:47:07 33S  72W   33 8.0      73  73   1  1996/02/21 12:51:01 10S  80W   10 7.5      94  94   6  2010/01/12 21:53:10 18N  73W   13 7.0      88          2009/08/16 07:38:21  1S  99E   20 6.6      88          2010/03/11 14:55:28 34S  72W   18 6.7      94  94   6  2010/01/12 21:53:10 18N  73W   13 7.0     
 102W   4W  74W  97W  92W  71E  72W  73W      78  78   1  1981/10/25 03:22:15 18N 102W   33 7.3      75  75   1  1992/10/23 09:11:09 31N   4W   29 5.6      25  25   3  2001/06/23 20:33:14 16S  74W   33 8.4      55  55   2  1999/09/30 16:31:15 16N  97W   61 7.5      79          1983/12/02 03:09:03 14N  92W   35 7.0      81          1981/05/02 16:04:56 36N  71E  220 6.5      87          1985/03/19 04:01:09 33S  72W   46 6.7      93          2007/01/17 16:08:48 17S  73W   56 5.0     
 140E  64W  77W 103W  93W  58E  73W  74W      75  75   1  1987/12/17 02:08:19 35N 140E   63 6.7      80  80   1  1985/03/19 10:28:36 19S  64W   33 5.8      17  17   3  2007/08/15 23:40:57 13S  77W   39 8.0      69  69   2  1973/01/30 21:01:12 18N 103W   43 7.5      78          1995/10/21 02:38:57 17N  93W  159 7.2      85          1995/05/26 03:11:17 12N  58E   62 6.5      94  94   6  2010/01/12 21:53:10 18N  73W   13 7.0      98          2016/01/07 15:40:43 42S  74W   24 5.0     
   4W  73W 172W 132W 102W  72W  77W  74W      75  75   1  1992/10/23 09:11:09 31N   4W   29 5.6      94  94   6  2010/01/12 21:53:10 18N  73W   13 7.0      32  32   2  2009/09/29 17:48:10 15S 172W   18 8.1      46          2012/10/28 03:04:09 53N 132W   20 7.8      78  78   1  1981/10/25 03:22:15 18N 102W   33 7.3      88          2010/03/11 14:55:28 34S  72W   18 6.7      88  88   1  1993/04/18 09:16:23 12S  77W  106 6.3      93          2013/06/05 09:14:53  8S  74W  152 5.2     
  20E  73W 174W 148W 148W  72W  78W  74W      75  75   1  1982/11/16 23:41:21 41N  20E   21 5.6      74  74   1  1994/03/02 03:38:03 20N  73W   59 5.4      47          2006/05/03 15:26:40 20S 174W   55 8.0      78          2002/11/03 22:12:41 64N 148W    5 7.9      78          2002/11/03 22:12:41 64N 148W    5 7.9      87          1985/03/19 04:01:09 33S  72W   46 6.7      91          1978/04/04 21:11:39 10N  78W    8 6.2      93          1989/05/02 02:33:30 42S  74W   29 5.1     
  35E  77W 174W 174W 172W  73W  79W  76W      74  74   1  1995/11/22 04:15:11 29N  35E   10 7.2      88  88   1  1993/04/18 09:16:23 12S  77W  106 6.3      38          1995/04/07 22:06:56 15S 174W   21 8.1      47          2006/05/03 15:26:40 20S 174W   55 8.0      74          1987/10/06 04:19:08 18S 172W   22 7.3      94  94   6  2010/01/12 21:53:10 18N  73W   13 7.0      89          1995/09/23 22:31:56 11S  79W   59 6.5      94          2018/12/06 04:17:24 15S  76W   10 5.0     
  90W  80W 175W 175W 175W  79W 172W  83W      74  74   1  1995/12/19 20:56:06 15N  90W   10 5.4      73  73   1  1996/02/21 12:51:01 10S  80W   10 7.5      75          1986/05/07 22:47:10 52N 175W   20 8.0      75          1986/05/07 22:47:10 52N 175W   20 8.0      75          1986/05/07 22:47:10 52N 175W   20 8.0      89          1995/09/23 22:31:56 11S  79W   59 6.5      90          2014/02/26 21:13:40 54N 172W  265 6.1      93          1973/01/02 03:47:52  5N  83W   30 5.2     
  73W  90W 175W 175W 175W  92W 172W 168W      74  74   1  1994/03/02 03:38:03 20N  73W   59 5.4      74  74   1  1995/12/19 20:56:06 15N  90W   10 5.4      78          1986/05/07 22:47:10 52N 175W   33 8.0      78          1986/05/07 22:47:10 52N 175W   33 8.0      78          1986/05/07 22:47:10 52N 175W   33 8.0      79          1983/12/02 03:09:03 14N  92W   35 7.0      92          2008/12/24 09:11:34 17S 172W    9 6.0      97          1977/05/15 15:50:47 52N 168W   33 5.3     
  80W 102W 178W 177W 178W 180W 177W 174W      73  73   1  1996/02/21 12:51:01 10S  80W   10 7.5      78  78   1  1981/10/25 03:22:15 18N 102W   33 7.3      33          2018/08/19 00:19:37 18S 178W  563 8.2      49          1997/10/14 09:53:18 22S 177W  167 7.8      73          1981/12/26 17:05:31 30S 178W   21 7.1      79          1979/11/16 15:21:24 17S 180W    6 6.8      86          1998/11/15 02:44:12 22S 177W  149 6.3      95          1979/12/16 21:27:56 20S 174W   39 5.5     
       The large number of 73 W longitude entries in Table 1 for the earthquake show that the computer program was able to find an unusually large number of matches between that earthquake and past earthquakes that occurred around that longitude.  That indicates that the earthquake was likely triggered by sun and moon gravity-related forces that were similar to the forces that triggered earthquakes in the past in that area.

       The earthquake itself also appears in all of the tables where it could be present.  Table 2 shows that it was the second best match for itself when compared with the 800 or so deadly earthquakes in the database file.  That means that the computer program equations were do a good job with matching the earthquake with itself.

       As the Table Data for those 800 or so earthquakes on the Significant-Earthquakes.html Web page show, that is usually, but not always, the case.

       The fact that the earthquake was a good match with itself is an indicator that it is likely that at least some of the EM Signals generated before the earthquake occurred would accurately point to the correct location for the earthquake.

Return To The Earthquake Research Homepage
Latest Web Page Format Update:  December 19, 2019
The first version of this Web page was stored at this site on
December 19, 2019. Comments regarding this Web site are welcome.
Please send them to: webmaster@earthquake-research.com
The information on this Web page represents expression
of personal opinion by the Web page author.
The address -URL- for this Web page is:
http://www.earthquake-research.com/eqf/Data-4.html