APRIL 25, 2015 NEPAL EARTHQUAKE
Latest Update:
May
1, 2015
People visiting this Web page for the first time should read the explanation section so
that they can understand the information in the line charts and the earthquake tables.
Understanding The Precursor Data On This Web Page
2015/04/25 06:11:26 28.15N 84.71E 15 7.8 Lamjung, Nepal
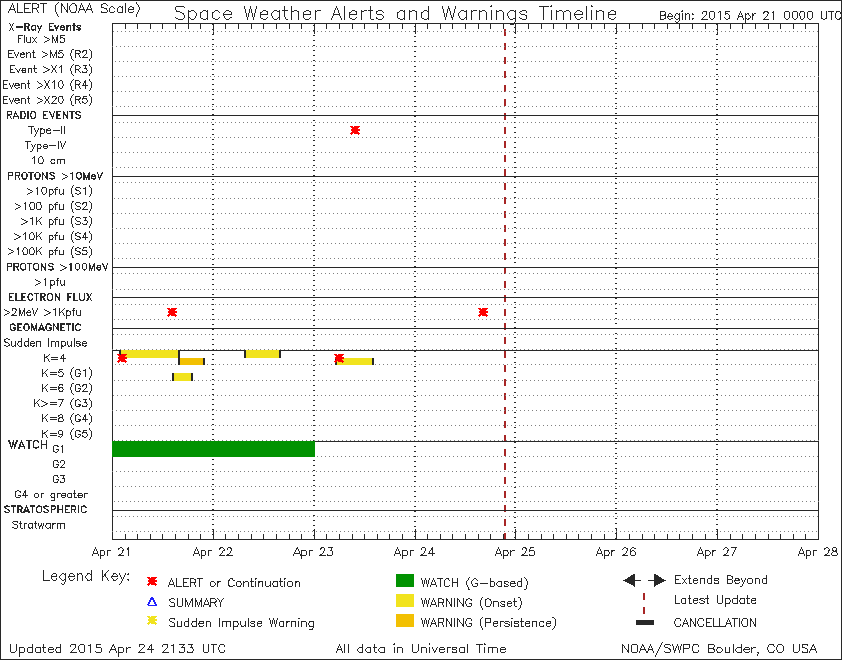
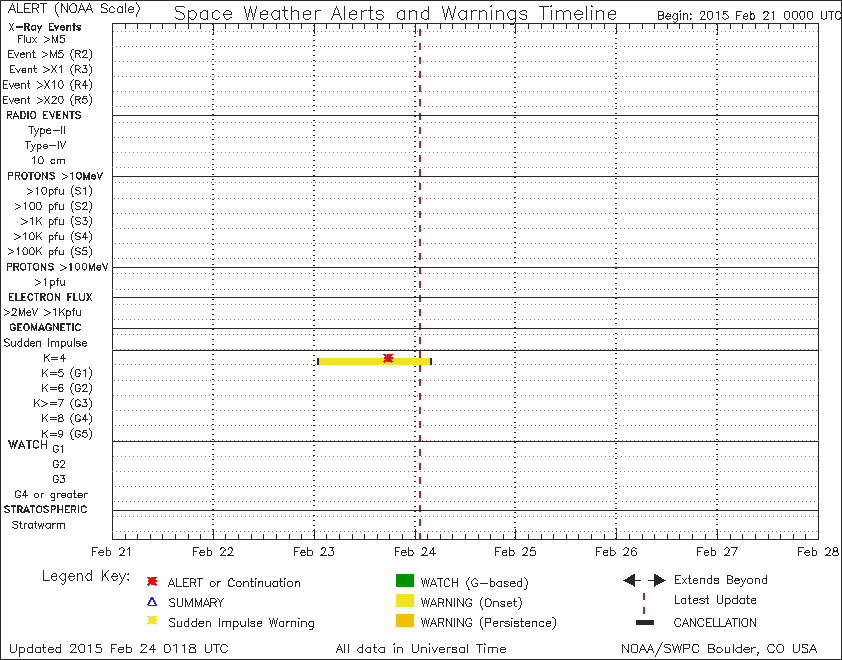
The NOAA Space Weather Chart shown below shows that there was no strong geomagnetic energy activity on April 24, 2015, the day that the
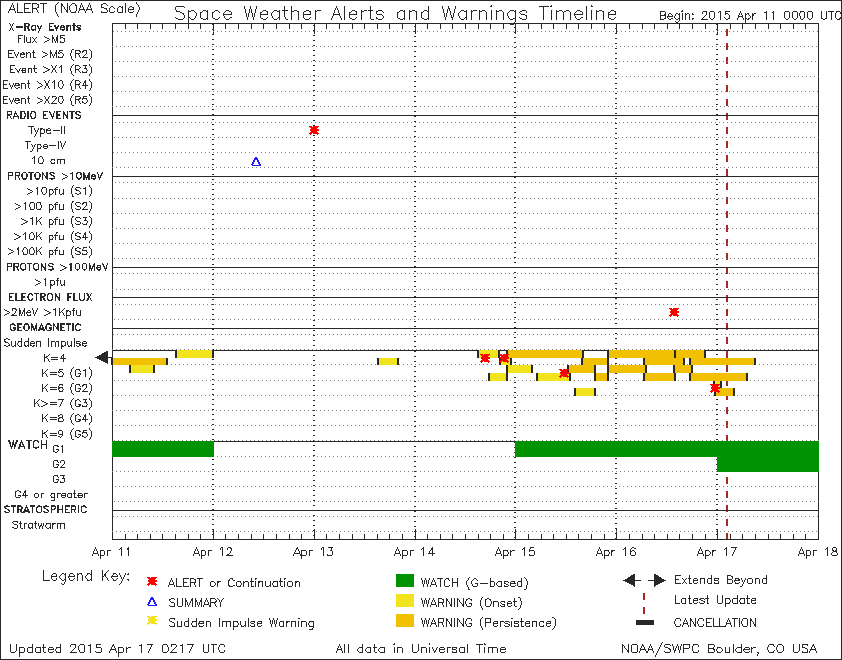
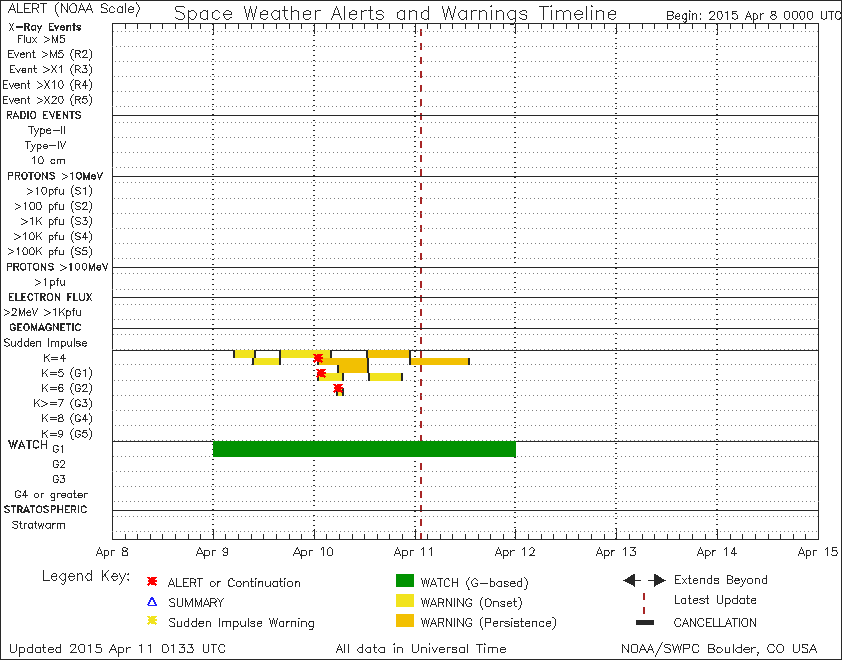
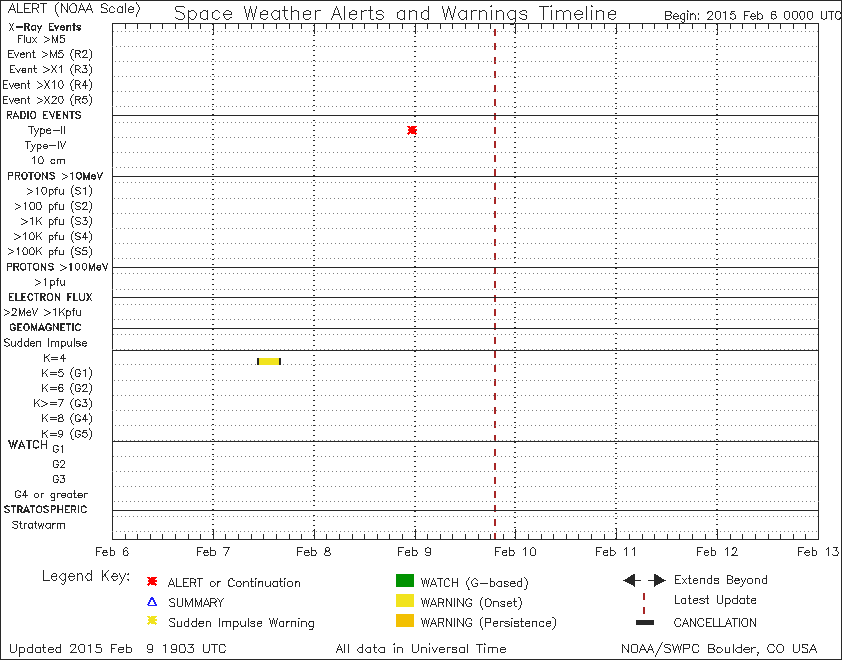
The yellow rectangle shaped bars on the NOAA Space Weather Chart
shown below indicate that there was strong geomagnetic energy
activity on April 10, 2015, the day that the 12:56:00 April 10, 2015 high intensity EM
Signal was detected.
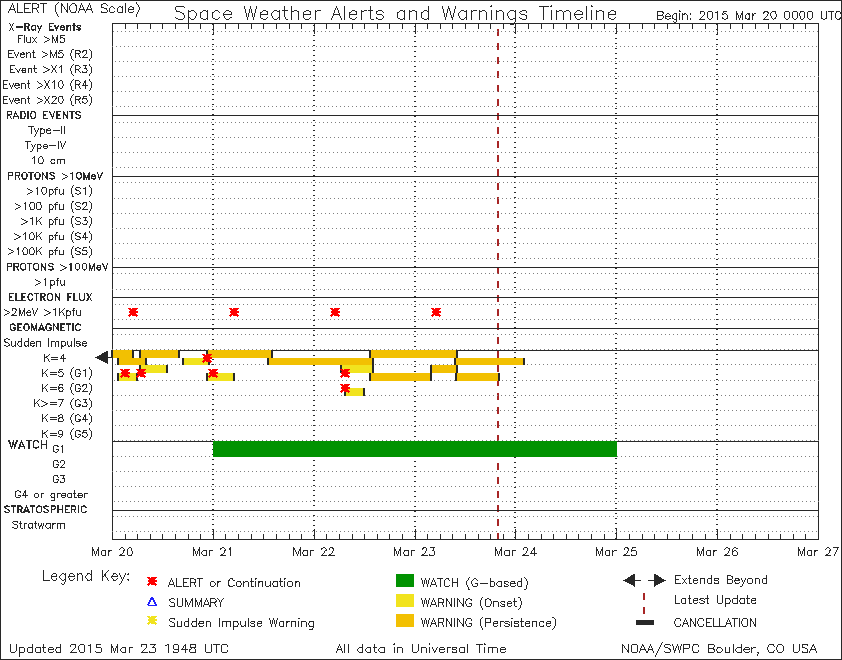
The yellow rectangle shaped bars on the NOAA Space Weather Chart
shown below indicate that there was strong geomagnetic energy
activity on March 22, 2015, the day that the 14:49:00 March 22, 2015 high intensity EM
Signal was detected
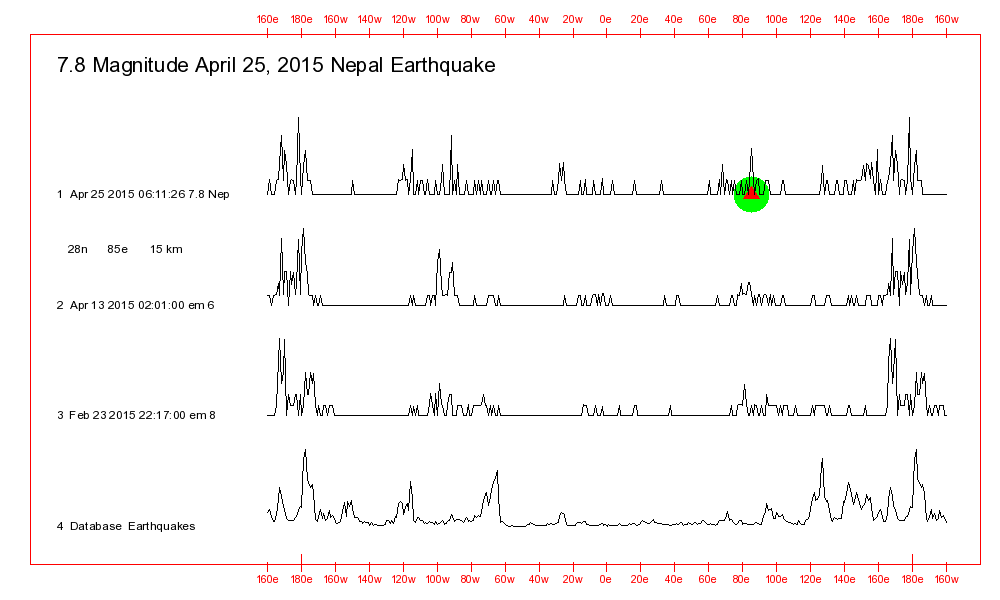
The chart below compares the April 25, 2015 Nepal earthquake with high intensity EM Signals that were detected on February 23 and April 13, 2015. Both EM Signals are good matches with the April 25 earthquake. And that suggests that the earthquake was triggered by the same sun and moon gravity related forces as caused the EM Signals to be generated.
The fact that there is a strong line peak at around 85 E on the earthquake line indicates that the earthquake was probably triggered by the same sun and moon gravity related forces that were responsible for the triggering of quite a few past earthquakes that occurred at that longitude.
The table below shows matches between the high intensity EM 7 signal detected on
April 24, 2015 and more than 700 past earthquakes that produced at
least one
fatality since the start of 1973.
Quite a few
high intensity EM Signals that were detected during the weeks and months before the
earthquake. A number of them are being discussed on this Web page. As of April 28,
2015 news reports are stating that the earthquake claimed more than 4000
lives.
What is significant with the table below is the fact that the 4th highest probability location in the table for the destructive August 20, 1988 earthquake is relatively close to the location where the tremendously destructive April 25, 2015 earthquake occurred.
2015/04/25 06:11:26 28.15N 84.71E 15 7.8 Lamjung, Nepal
Pa Pd Fatal Earthquake Data
88 100 14 1990/05/30 10:40:06 45.84N 26.60E 89 7.1
87 98 7 2000/01/14 23:37:07 25.61N 101.00E 33 5.9
86 97 6 1985/01/26 03:07:01 33.11S 68.59W 19 5.8 Mendoza, Argentina
85 96 1450 1988/08/20 23:09:11 26.73N 86.59E 62 6.9 Nepal-India border region
84 95 12 2005/06/13 22:44:33 19.93S 69.03W 117 7.8 TARAPACA, CHILE
81 92 1 1991/06/21 06:27:39 13.40N 89.60W 76 5.3
81 92 2 1984/01/08 15:24:15 2.86S 118.71E 34 6.7 Sulawesi, Indonesia
81 92 3 1993/09/21 03:28:55 42.31N 122.00W 10 6.0
81 91 5 1978/04/15 23:33:49 38.38N 15.07E 17 5.9 Sicily, Italy
80 90 5000 1987/03/06 04:10:44
0.08N 77.79W 18 7.2 Colombia-Ecuador border region
79 89 3 2011/09/05
17:55:14 2.97N 97.99E 10 6.6 NORTHERN SUMATRA,
INDONESIA
79 89 1 1987/03/05 09:17:05 24.40S 70.10W 46 7.6 Antofagasta, Chile
78 88 2 1981/03/10
15:16:19 39.48N 20.70E 31 5.6 Greece-Albania border region
76 86 500 2004/02/24 02:27:46
35.22N 3.95W 1 6.4 NEAR NORTH COAST OF MOROCCO
76 86 70 1977/11/23 09:26:26 31.08S 67.78W 17 7.5 San Juan, Argentina
76 86 3 1998/08/27 09:03:36 39.66N 77.30E 33 6.4
74 84 2 1986/05/13
08:44:03 41.41N 43.70E 10 5.5 Georgia (Sak'art'velo)
74 83 1 1985/02/02 20:52:34 28.40N 53.00E 37 5.5 southern Iran
73 82 20 1984/12/30 23:33:36
24.67N 92.85E 2 5.9 India-Bangladesh border region
72 82 1885 1999/01/25 18:19:17 4.29N 75.68W 33 5.8 COLOMBIA
The 16th highest
probability location in the table is the April 25, 2015 earthquake
itself. And that means that the signal would have pointed to the
exact location of the earthquake if a past earthquake that had that
earthquake's triggering characteristics were in my database file.
2015/04/25 06:11:26 28.15N 84.71E 15 7.8 Lamjung, Nepal
Pa Pd Fatal Earthquake Data
78 94 1621 1990/07/16 07:26:34 15.68N 121.10E 25 7.8
74 89 2
2000/11/16 04:54:56 3.97S 152.32E 33 8.0 NEW IRELAND REGION,
P.N.G.
68 82 435 2010/10/25
14:42:23 3.48S 100.11E 21 7.7 KEPULAUAN MENTAWAI REGION,
INDONESIA
67
2009/10/07 22:03:16 13.05S 166.18E 35 7.8 VANUATU
65 79 400 1993/07/12 13:17:11 42.85N 139.20E 16 7.7
63 1994/03/09 23:28:06 18.04S 178.40W 562 7.6
63 76 600 1979/12/12
07:59:04 1.60N 79.36W 24 8.1 near the coast of Ecuador
62
2006/01/27 16:58:49 5.45S 128.07E 346 7.6 BANDA SEA
60 73 78 1974/10/03
14:21:34 12.25S 77.52W 36 8.1 near the coast of central
Peru
58
2005/09/26 01:55:37 5.68S 76.40W 115 7.5
56
1981/07/06 03:08:25 22.25S 171.81E 30 7.6 southeast of the
Loyalty Islands
54 1997/04/21 12:02:26 12.58S 166.60E 33 7.9
53 1995/05/16 20:12:44 23.01S 169.90E 20 7.8
48 1998/01/04 06:11:58 22.30S 170.90E 100 7.5
47
1984/02/07 21:33:21 9.97S 160.57E 9 7.6 Solomon
Islands
47 57 4000 2015/04/25 06:11:26 28.15N 84.71E 15 7.8 34km ESE of Lamjung, Nepal
47 1997/10/14 09:53:18 22.10S 176.70W 167 7.8
43
2010/06/12 19:26:50 7.74N 91.93E 35 7.5 NICOBAR
ISLANDS, INDIA REGION
43 52 1
2012/08/31 12:47:34 10.82N 126.62E 35 7.6 PHILIPPINE ISLANDS
REGION
43 1980/04/13 18:04:40 23.59S 177.22W 149 7.6 south of the Fiji Islands
2015/04/25 06:11:26 28.15N 84.71E 15 7.8 Lamjung, Nepal
5 And Higher Magnitude Earthquake Matches For The 2015/04/13 02:01:00 EM 6
Signal
The table below shows matches between the high intensity EM 7 signal detected on
April 10, 2015 and more than 700 past earthquakes that produced at
least one
fatality since the start of 1973.
2015/04/25 06:11:26 28.15N 84.71E 15 7.8 Lamjung, Nepal
Pa Pd Fatal Earthquake Data
84 100 1 1990/06/14 12:47:28 47.87N 85.00E 57 6.8
78 92 44 2002/02/03 07:11:29
38.56N 31.11E 10 6.2 A AFYON PROVINCE, TURKEY
76 90 165 2002/03/03 12:08:06
36.44N 70.45E 194 7.2 A HINDU KUSH REGION, AFGHANISTAN
76 90 1100 1997/02/28 12:57:18 38.08N 48.00E 10 6.1
74 88 51 2010/03/08 02:32:35 38.87N 39.99E 12 6.1 EASTERN TURKEY
72 86 10 2005/11/27 10:22:00 26.80N 55.80E 10 5.9 SOUTHERN IRAN
72 85 100 2011/09/18 12:40:48 27.72N 88.06E 20 6.9 SIKKIM, INDIA
70 83 1000 2005/03/28 16:09:36 2.06N 97.01E 30 8.7 NORTHERN SUMATRA, INDONESIA
70 83 6 2008/11/16 17:02:32 1.27N 122.09E 30 7.3
69 82 100 1989/05/27 20:08:38 30.15N 50.89E 26 5.9 southern Iran
65 77 3 1975/04/05 09:34:37 10.07N 69.67W 23 6.1 Lara, Venezuela
64 75 4 2003/11/14 18:49:00 27.20N 103.60E 10 5.1 YUNAN, CHINA
62 73 2683 1998/07/17 08:49:00 3.08S 141.76E 33 7.0
61 72 2100 2001/01/13 17:33:31
12.77N 88.83W 60 7.6Mw B OFF COAST OF CENTRAL AMERICA
60 72 5300 1974/12/28 12:11:44 35.02N 72.90E 15 6.2 Pakistan
59 71 4 1992/08/28 00:50:50 29.09N 66.70E 9 5.5
59 70 3 2007/06/02 21:34:58 23.01N 101.07E 10 6.1 YUNNAN, CHINA
58 69 643 1983/12/22 04:11:30 11.86N 13.51W 8 6.3 Guinea
58 69 2 1995/02/23 21:03:01 35.05N 32.20E 10 5.9
57 68 3 2003/10/16 12:28:08 25.89N 101.34E 33 5.6 YUNNAN, CHINA
The table below shows matches between the high intensity EM 6 signal
detected on March 22, 2015 and more than 700 past earthquakes that
produced at
least one
fatality since the start of 1973.
2015/04/25 06:11:26 28.15N 84.71E 15 7.8 Lamjung, Nepal
It is
significant that the 17th highest
probability location in the table is relatively close to the location
where the April 25 earthquake occurred.
2015/04/25 06:11:26 28.15N 84.71E 15 7.8 Lamjung, Nepal
5 And Higher Magnitude Earthquake Matches For The 2015/02/23 22:17:00 EM 8 Signal
2015/04/25 06:11:26 28.15N 84.71E 15 7.8 Lamjung, Nepal
Return To Earthquake Research Homepage
The first version of this Web page was stored at this site on
April 29, 2015. Comments regarding this Web site are
welcome.
Please send them to: webmaster@earthquake-research.com
The information on this Web page represents expressions of
personal
opinion by the Web page author. The address -URL- for this Web
page is:
http://www.earthquake-research.com/archive/2015-04-25-Nepal.html